Deep Stops Increases DCS

Please register or login

Welcome to ScubaBoard, the world's largest scuba diving community. Registration is not required to read the forums, but we encourage you to join. Joining has its benefits and enables you to participate in the discussions.

Benefits of registering include

  • Ability to post and comment on topics and discussions.
  • A Free photo gallery to share your dive photos with the world.
  • You can make this box go away

Joining is quick and easy. Log in or Register now!

Status
Not open for further replies.
Well I'm not suggesting they have no use elsewhere.. :rolleyes:. They just have very limited use for a dive decompression, and they show no valuable or controlling limiting data.

.
Color coded 3d plots are very efficient for conveying large amounts of data in a simple way, regardless of what type of data you want to present. Why is deco so exceptional?

Those plots show modelled supersaturation for a bunch of theoretical compartments in one figure, in a quick, efficient and pedagogical way. Just as it was intended.

NO. there is no specific supersaturation information shown... Must not mix up the descriptive terms here. The heat graphs are built to show combined tissue gradients, not supersaturation. As such the information is not useful to a decompression calculation.

.
 
Last edited:
Yes, that is the reason for VPM-B. To restore a missing parameter in the central equation.

AFAIK Erik Baker introduced a Boyle's Law compensation subroutine with VPM-B, but
the bubble model parameters in VPM-B are still the same for all compartments. Same
Skin_Compression_GammaC, same Surface_Tension_Gamma, same
Crit_Volume_Parameter_Lambda, same
Critical_Radius_N2_Microns, same Critical_Radius_He_Microns, for all compartments.

There's no physiological reason for this. The tissues in the human body are not all the same.

Regarding calibration with experiments:

In the update explanation for VPM-B, Erik Baker writes "The new program tends to be somewhat conservative and the Critical Radii may need to be dialed down a little (try for example 0.55 to 0.7 for N2 and 0.45 to 0.6 for He). Also the Critical Volume parameter Lambda may need to be reduced a little to say 6500."

In the Fortran code of VPM-B, there's the comment "
C The critical
C volume limit is set by the Critical Volume Parameter Lambda in the program
C settings (default setting is 7500 fsw-min with adjustability range from
C from 6500 to 8300 fsw-min according to Bruce Wienke)."

Setting these values has a big impact on the resulting deco schedule and on the shape of the decompression curve, like the M-Values in Buhlmann. Where do all of these numbers in VPM-B come from? Any experiments behind it, like Buhlmann did to determine the M-Values?
 
AFAIK Erik Baker introduced a Boyle's Law compensation subroutine with VPM-B, but
the bubble model parameters in VPM-B are still the same for all compartments. Same
Skin_Compression_GammaC, same Surface_Tension_Gamma, same
Crit_Volume_Parameter_Lambda, same
Critical_Radius_N2_Microns, same Critical_Radius_He_Microns, for all compartments..


Yes, and the issue corrected, was, the iterative process called for the initial ascent calculation to be carried up all steps, but in doing so, the ambient pressure argument was not correct. Hence the -B, effectively unrolls the initial calculation at each ascent step, corrects the microbubble changes, and then computes the step values.

Now also if you read the Bennett Elliot Chapter, that describes the VPM model in detail, somewhere it also speaks of this omission.

You may not know this, but this the entire modern VPM development process, was done in the community of deco experts and scientists at the time (late 90's onwards), on a usenet list (Maiken Yount, Baker, Pyle, many others too). If you want to know the answers to many of these complex decisions, then its all there for reading. Send me a PM for a link - i have the almost the whole list archived.


There's no physiological reason for this. The tissues in the human body are not all the same.

Since when do models represent physiology so perfectly? Never.


Regarding calibration with experiments:

In the update explanation for VPM-B, Erik Baker writes "The new program tends to be somewhat conservative and the Critical Radii may need to be dialed down a little (try for example 0.55 to 0.7 for N2 and 0.45 to 0.6 for He). Also the Critical Volume parameter Lambda may need to be reduced a little to say 6500."

In the Fortran code of VPM-B, there's the comment "
C The critical
C volume limit is set by the Critical Volume Parameter Lambda in the program
C settings (default setting is 7500 fsw-min with adjustability range from
C from 6500 to 8300 fsw-min according to Bruce Wienke)."

Setting these values has a big impact on the resulting deco schedule and on the shape of the decompression curve, like the M-Values in Buhlmann. Where do all of these numbers in VPM-B come from? Any experiments behind it, like Buhlmann did to determine the M-Values?

Yes, with the addition of the -B code, it changes the shape and style of the ascent, to much longer and curvier in the middle. So the calibration points of CR were brought down realign the profiles.

I have to say, when the -B was added, it really made VPM come alive, and it responded and fitted well to all types of dive profiles. It made VPM-B very versatile and was the missing piece. As I said above, its the only model today, that can make real world dive plans, straight out of the box. No fiddling needed. From NDL to 100m, to long or shallow and all places in between.

20% of my old X1 V-Planner Live program customers still use a VPM-B plan in with 0 or +1 settings. That's about 25,000 dive records in our database.

.
 
NO. there is no specific supersaturation information shown... Must not mix up the descriptive terms here. The heat graphs are built to show combined tissue gradients, not supersaturation. As such the information is not useful to a decompression calculation.

.
I can't see that you're really answering my question. Let me ask again:

Color coded 3d plots are very efficient for conveying large amounts of data in a simple way, regardless of what type of data you want to present. Why is deco so exceptional?
 
For those interested in the heat map ...

The heat map maps SUPERSATURATION and rates of on gassing to colors that are relative to each other.

So, for example, in the VPM-B+3 profile the diver exits the water with the middle compartments at about 95% of Buhlman's M-Value. GF60/75 gets out at 75% of Buhlmann's M-Value. The big blob of red at the 90 minute mark for VPM reflects that it is exiting the diver "hotter" (higher supersaturation) than GF. The color for the GF profile roughly maps to the color that is about 78% (75/95) on the color legend. The opposite occurs early in the dive when GF has "hotter" fast compartments since VPM is keeping the diver deeper.

If the highest supersaturation in a compartment does not exceed 95% of Buhlmann's surfacing M-Value, then the relative coloring is done based on 95% of Buhlmann's surfacing M-Value (in this chart). This can be seen if you look at compartment 16. Nowhere during the dive does it get "red". That is because it's supersaturations remain pretty low throughout the dive. If you don't do this you get a lot of red in compartments that have relatively low supersaturation values.

For those of you who do photography, think of this exercise as modifying the light and contrast balance to draw out differences. A dark photo might have something in there if you change the contrast levels. Same idea here.

Ross was the reason the map was produced. During the infamous Deep Stop thread on RBW, he kept saying the analysis up to a certain point could not say anything about the "complex ongassing and offgassing (now supersaturation) patterns" of the profiles. The heat map shows the complex patterns, which profile is hot relative to the other at any point in the dive, etc. The surprise to many, myself included, was that when the heat map showed A2 (failed NEDU profile) against VPM-B and A1 (successful NEDU profile) against GF, the patterns were rather obviously related -- VPM was much closer to A2 and GF closer to A1. I think it's safe to say that started to shift opinion which had been paralyzed by Ross's continued objections and posting of voluminous meaningless charts.

Below you can see the ongassing and supersaturation color legend. You can also see that each color cell represents 12 seconds of the dive/surface time. For this dive that represents over 15,000 data points. Again, heat maps can be effective at summarizing visually a lot of data.

The key point: this pattern of bubble model supersaturation where the diver stays deep and keeps the fast compartments at pretty low supersaturation levels, but at the cost of higher supersaturation at the surface, was what the NEDU study (to their surprise) showed did not work in their manned trials. That's the point. GF's natural tendency to get the diver shallower much quicker (especially at levels like GF40/70) better reflects the findings of the NEDU study.

upload_2016-7-27_9-51-51.png
 
For those interested in the heat map ...

The heat map maps SUPERSATURATION and rates of on gassing to colors that are relative to each other. . .

The key point: this pattern of bubble model supersaturation where the diver stays deep and keeps the fast compartments at pretty low supersaturation levels, but at the cost of higher supersaturation at the surface, was what the NEDU study (to their surprise) showed did not work in their manned trials. That's the point. GF's natural tendency to get the diver shallower much quicker (especially at levels like GF40/70) better reflects the findings of the NEDU study. . .
Nice recitation to tie back in the thread (again!). Still would like to know how the variable of the Immuno/Inflammatory System figures in, and looking for various definitive "biomarkers" of its reactionary complement activation indicating sub-clinical stress to acute signs & symptoms of DCS. And even if we do finally find these bloodstream biomarkers, the technology to monitor them in vivo (i.e. Realtime during a dive like today's technology of rudimentary biometric monitoring of heart & breathing rate for example) doesn't exist yet.

The NEDU study apparently shows the Deep Stops model not to be any more efficient than a Shallow Stops model, with the Deep Stops model exhibiting greater incidence of DCS within the experimental paradigm (and this is where Ross has the greatest disagreement in the way the experimental method was set up & tested).

Again, IMO the practical take from all this is if you still want to use a Deep Stop Model like VPM to address Fast Neuro Tissue Supersaturation stress & potential micro bubble formation early in the deco profile (which is not as serious a case as the NEDU Deep Stops implies & what Dr. Simon Mitchell contends compared to the resultant inert on-gassing & eventual supersaturation stress on the Slow Tissues); you may just have to extend your shallow stops (preferably on O2) to effectively clear the Slow Tissues as shown by heat maps above, and especially if diving a high FN2 bottom mix like Air.
 
Last edited:
Still would like to know how the variable of the Immuno/Inflammatory System figures in, and looking for various "biomarkers" of its reactionary complement activation indicating sub-clinical to acute signs & symptoms of DCS.

Yes, this is the million-dollar question! I'm not aware of any studies that have addressed this directly. We now understand that inflammatory responses figure into DCS, and may be particularly important for lower grade "hits" and symptoms. Unfortunately, getting these kinds of empirical data are difficult, but it is an area in dire need of study.
 
I can't see that you're really answering my question. Let me ask again:

Color coded 3d plots are very efficient for conveying large amounts of data in a simple way, regardless of what type of data you want to present. Why is deco so exceptional?

Yes 3d plots are good at showing trends in data.

But these heat graphs of Kevin, only show / on / off gassing. That's interesting, its tissue gradients, or tissue saturation, but NOT supersaturation, not decompression limits, not how deco is calculated.

Tissue gradients are 90% noise, they go up they go down, but that is not decompression or supersaturation information.
 
For those interested in the heat map ...

The heat map maps SUPERSATURATION and rates of on gassing to colors that are relative to each other.


No. Your graphs show tissue pressure changes. Tissue pressures are not supersaturation. You show percentages, of some internal tissue pressure value. Supersaturation is not a percentage.

Supersaturation is where deco is calculated and limits are made. Your graphs do not show that. I'm sorry you do not seem to know or appreciate the differences. They are important.


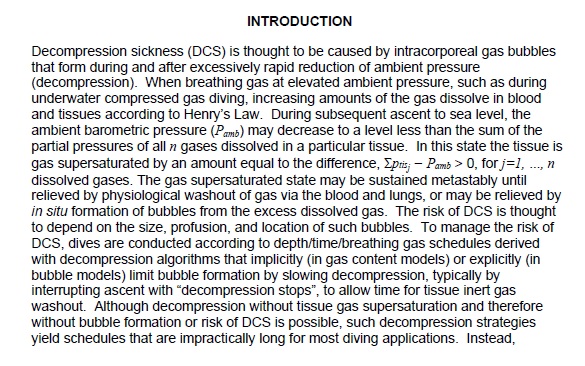
David describes some pressure relationships here it here:


dd_intro_tr11-06.jpg


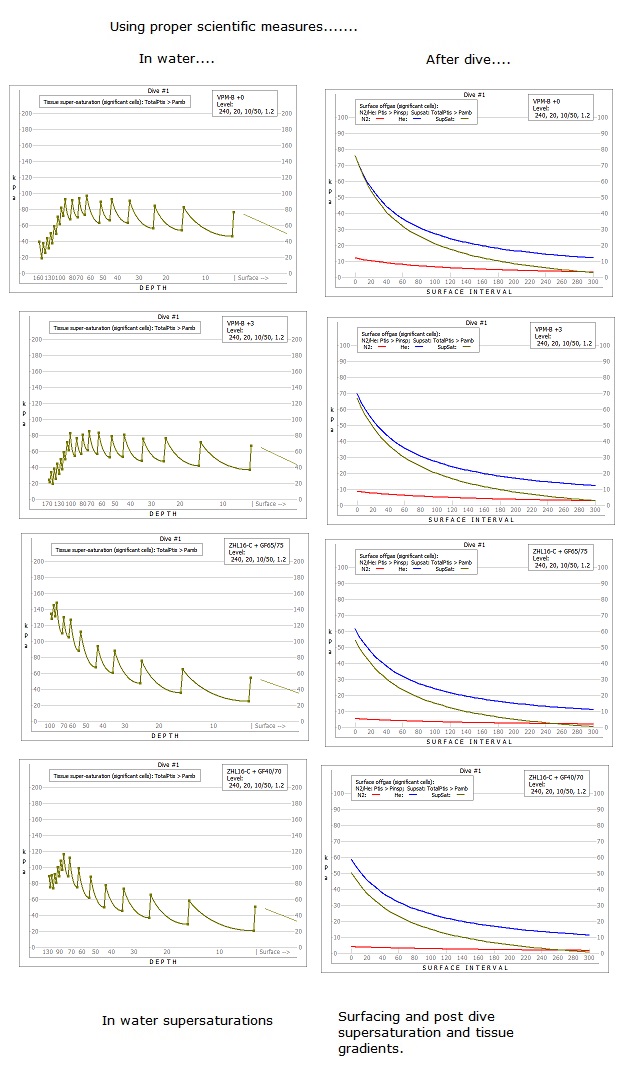
Here are supersaturation graphs - this is where decompression limits are made:

kw-real_compare.jpg


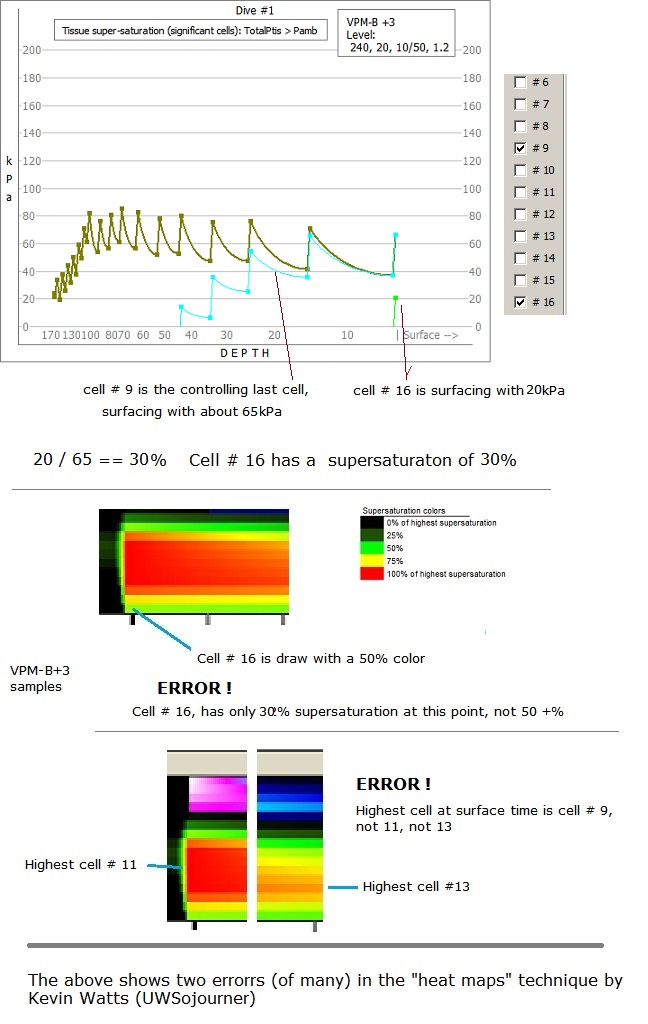
Let me demonstrate the error in your technique and graphs;


kw_map-errors1.jpg


Those are just two errors. There are many more.

This stuff is difficult, and sadly these popular heat maps has disseminated invalid and error prone information. You should have validated your math and terminology properly before starting this. Sadly the two most trusted people to do that, were too busy playing politics to stop this mistakes.

The amount of damage done to decompression knowledge, based on the mistakes in thses heat graphs here, is unbelievable. The pretty pictures have caused a lot of people make some very bad and invalid decisions.

I'm sorry Kevin, but your heat maps do not show supersaturation pressures, or decompression information.

.
 
Last edited:
Status
Not open for further replies.
https://www.shearwater.com/products/swift/
http://cavediveflorida.com/Rum_House.htm

Back
Top Bottom