Deep Stops Increases DCS

Please register or login

Welcome to ScubaBoard, the world's largest scuba diving community. Registration is not required to read the forums, but we encourage you to join. Joining has its benefits and enables you to participate in the discussions.

Benefits of registering include

  • Ability to post and comment on topics and discussions.
  • A Free photo gallery to share your dive photos with the world.
  • You can make this box go away

Joining is quick and easy. Log in or Register now!

Status
Not open for further replies.
My understanding of all of this to-and-fro arguing:

It appears that DCS incidence is higher with a saturation of slow tissues rather than initial fast tissue saturation.

For a given dive with a resulting deco time, I am better off distributing that time shallower, where my fast tissues may be more saturated initially, but my slow tissues are less saturated at surfacing. In order to do dive planning in a way that ensures that I don't spend that time deeper than necessary, I can increase my GF Lo to (for example) 40 or 50 rather than say the 30 that my SW defaults to.

Am I missing the point?
 
My understanding of all of this to-and-fro arguing:

It appears that DCS incidence is higher with a saturation of slow tissues rather than initial fast tissue saturation.


Yes... and,...

For a given dive with a resulting deco time, I am better off distributing that time shallower, where my fast tissues may be more saturated initially,

No.


Fast tissues will cause you DCS as well. Just ask any NDL diver who abuses the limits - its all fast tissue abuse. Ask a surface chamber deco diver - he has to get into the pot within 5 mins, else fast tissues will cause him pulmonary DCS - also from fast tissue.


There is no one or the other choice - you have to do it all.


but my slow tissues are less saturated at surfacing. In order to do dive planning in a way that ensures that I don't spend that time deeper than necessary, I can increase my GF Lo to (for example) 40 or 50 rather than say the 30 that my SW defaults to.

Am I missing the point?


For 99.995% of us, it does not matter what plan you do - they all work.

There is no advantage in 40 or 50, because its almost the same as the 30 - the difference is so tiny in supersaturation, that the change is almost invisible in supersaturation terms. The deco is not that finely tuned.

Remember also you are only doing an ascent rate of max 6m /min (or maybe slower), so that is roughly equal to 30 second stops.

If you really want to make a difference - do a 90/90.

.
 
Last edited:
The heat map below shows the supersaturation patterns for......


Wrong Kevin. You have to stop posting these blatantly false claims. You are NOT showing supersaturation.

kw_not-ss.jpg


You cannot keep making these same mistakes Kevin. You have done an enormous amount of damage to decompression knowledge, based on these mistakes you have made.

You denial will not solve this. Fix your errors.

.
 
Last edited:
Warning.

Ignore all references to VPM-B+7 in these heat graph diagrams.

There is no such thing as a VPM-B +7. It is FAKE !

They could not make any real connection to VPM-B, so they just made up a FAKE profile.

Pathetic. A deliberate deception. A straw man argument.


Heat graphs are not valid measure of decompression either - it is a fabrication to suit an agenda too.

.
 
Last edited:
My understanding of all of this to-and-fro arguing:

It appears that DCS incidence is higher with a saturation of slow tissues rather than initial fast tissue saturation.

For a given dive with a resulting deco time, I am better off distributing that time shallower, where my fast tissues may be more saturated initially, but my slow tissues are less saturated at surfacing. In order to do dive planning in a way that ensures that I don't spend that time deeper than necessary, I can increase my GF Lo to (for example) 40 or 50 rather than say the 30 that my SW defaults to.

Am I missing the point?
That seems to be a reasonable summary/application of the NEDU study. De-emphasizing deep stops seems like a prudent step.

These presentations are helpful.

Doolette

Mitchell - "Approaches that emphasize deep stops are not supported by available data and have probably been 'oversold' to the technical diving commmunity" "Best evidence suggests we should de-emphasize deep stops, but it remains uncertain by how much."
 
Well, it looks like the little evil error elves came out while I slept.

Wrong Kevin. You have to stop posting these blatantly false claims. You are NOT showing supersaturation.

Charge 1 Ross points to a color on a chart and says "This is NOT supersaturation".
I have to agree. "Green" is not supersaturation.

Charge 2 The heat map is not predicting risk.
Ah, yes. Of course. It never claimed to predict risk. And I have been very careful to say what it does do.
See this link. Point #3 says, "Remember that the heat map is comparative only. The colors scale each compartment's supersaturations between the four profiles. "Red" does not mean danger, it means highest observed supersaturation between any profile for that compartment."

There are many other things the heat map does not do: it doesn't provide effective birth control (although the nerd factor may help in that regard), it doesn't contribute to global warming despite the red in the chart, and it won't help you locate a wreck in low vis. So what. What it claims to do is visually show the relative pattern of supersaturation across all compartments and for each point in a dive between the profiles it shows. And it does do that.

Charge 3 The underlying calculations that produce the heat map colors have some fundamental error in them (e.g. not really based on supersaturation, etc.)
This is false. It should be intuitive that this is not the case since the colors align with what you'd expect. As with all the other "errors" you pointed out throughout the deep stops threads, you have made some fundamental mistakes (in this case both in reading my description of the chart, and in the values you picked to "expose the error").

....

The heat map is only really helpful because we have two profiles (A2 and A1) with known risk established by the NEDU trials. Ross spent A LOT of energy trying to distance VPM from A2 (the failing deep stop profile). One of his attempts was with statements such as "You can't account for the complex underlying off gassing characteristics of the profiles." The heat map was designed to show those complex patterns. And I think it does that pretty well. Unfortunately for Ross even a cursory glance shows how similar the NEDU A2 is to VPM (especially when compared to A1). Thus Ross's attempt to discredit the chart.
 
Last edited:
But the problem I have is this: there doesn't seem to be a real authority by which I could learn what I need to know.

The best authority would be Dr Simon Mitchell, his presentation here pretty much sums up nicely this whole argument.

It's interesting to note the changing narrative concerning bubble models like VPM. In the early days the primary selling point of VPM was that total decompression time could be reduced by utilising their deep stops. Now the promoters of VPM have back peddled on this over the years, and slowly changed the narrative behind the models to the point they now deny this was ever the case.

One of the things that always concerned me about bubble models like VPM was the lack of human testing, when compared with the extensive testing behind the Buhlmann model.


Unfortunately, Simon Mitchell turned that opportunity, to an unnecessary and unjustified attack on VPM. The video has many errors, and miss-informations given about VPM, about model decompression, about VGE, about evidence.


Let me fix a couple right now that you said.

"the changing narrative concerning bubble models like VPM. I" "promoters of VPM have back peddled on this over the years"

This is a wrong. I have never back peddled on anything to do with VPM - never needed too. His claim that bubble model purpose was to try to eliminate bubbles, is absurd. His claim that VPM model is regulating VGE is absurd. His implied role of VGE is wrong too. He knows all that, but says it anyway.

The actual purpose, Bubble models have always recognized / theorized that extravascular (tissue) microbubbles exist, need to be regulated and limits the ascent to keep that tissue bubble growth size in check. How could anyone confuse that purpose, with trying to eliminate them?

Simon invents a (fake) straw man argument, and you fell for it.....


The errors in Simons video are many,


He compares a super deep stop with Lo GF 10/x (not VPM), to an absolute shallow stop Hi GF 100/x (not VPM). VPM-B does not provide any of that.


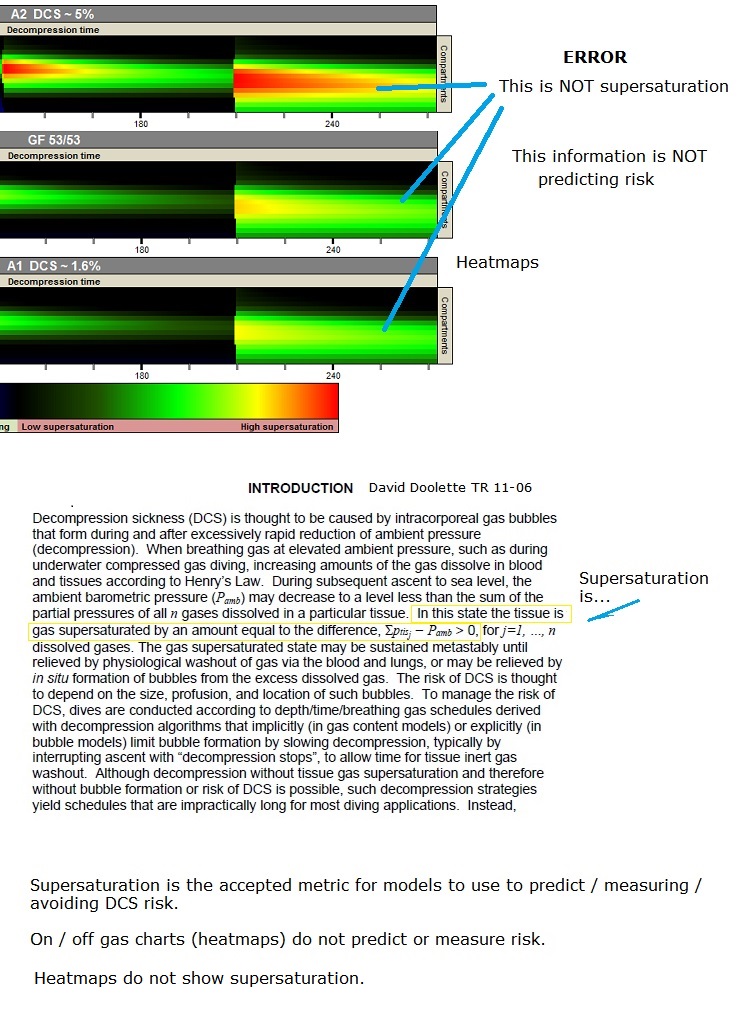
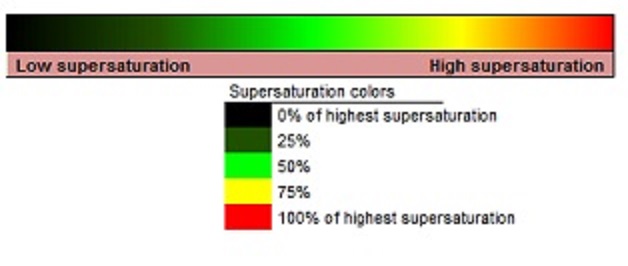
Simon tries to show how model off gas works but he completely misses the difference between supersaturation and tissue offgas. It's significant, and it changes his presentation significantly. Its the same errors that Kevin makes here. He also draws pressure where none exists. He draws pressure line cross that never actually meet.


He forgets that all models address on/off gassing, and the same exact formula is used in ZHL, ZHL +GF, and VPM-B. It ludicrous to suggest that these formula work correctly in one model, but not another.


It goes on and on.....


But worst of all, he points to these heat graph errors and tries to show them as evidence. He should has checked them first, he should have done his homework. Because he would discover the same errors as I'm pointing out here.

The blind leading the blind. It's a case of - have pretty (but invalid) pictures, they look convincing, damn the science, lets use them anyway, because the audience will never know. :rolleyes:


He drags VPM-B into the nedu argument by using a fake profile, and connects it up with Kevins attractive, but invalid heat graphs. Two deliberate errors - the truth VPM-B is not connected to the nedu test, and all these attempts are invalid.


In summary he says use a GF 40/x profile, which a 1/ is still a deep stop!, and 2/ almost the same as VPM-B, so the conclusion is hypocrisy, and a dirty trick to create animosity against VPM-B. Remember that please.

.
 
Last edited:
Well, it looks like the little evil error elves came out while I slept.

Charge 1 Ross points to a color on a chart and says "This is NOT supersaturation".
I have to agree. "Green" is not supersaturation.


kw_whatis_ss.jpg


Kevin says ""Green" is not supersaturation." But clearly is Green (50 to 75%) is half way between Low and High supersaturation.


So Kevin, you see how confusing and invalid your graphs are? If 50 to 75% is "not" supersaturation, then in means that half of your graph details is invalid.

For a science chart, with a 50-75% error - not good enough.

You have been allowed to get away with these mistakes for 3 or 4 years. Look at all the fake conclusions and plain mistakes that have been drawn from your invalid charts.

.
 
Last edited:
Kevin says ""Green" is not supersaturation." But clearly is Green (50 to 75%) is half way between Low and High supersaturation...
I think you missed what I said. Your critique was unclear. You pointed to a color and said "That it not supersaturation".

A color isn't supersaturation. The color represents a certain relative level of supersaturation between the profiles shown. in this case the lighter green is 50% of the high. It's not a range. The colors start blending at anything lower or higher.
 
Last edited:
Status
Not open for further replies.
https://www.shearwater.com/products/swift/
http://cavediveflorida.com/Rum_House.htm

Back
Top Bottom