2 Questions RE Suunto Dive Manager

Please register or login

Welcome to ScubaBoard, the world's largest scuba diving community. Registration is not required to read the forums, but we encourage you to join. Joining has its benefits and enables you to participate in the discussions.

Benefits of registering include

  • Ability to post and comment on topics and discussions.
  • A Free photo gallery to share your dive photos with the world.
  • You can make this box go away

Joining is quick and easy. Log in or Register now!

Deefstes

Contributor
Messages
1,396
Reaction score
49
Location
Johannesburg, South Africa (not close enough to th
# of dives
100 - 199
Hi all,

I've just logged dive number 4 with my Suunto Mosquito (dives 1-3 were just goofing off in a swimming pool so this is the first real dive). Now I'm getting to grips with the SDM software - I have version 2.6.0

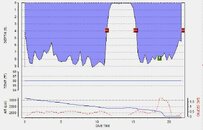
First of all, the Mosquito is not air integrated but by entering the starting pressure and final pressure into the dive log, the software calculates my Surface Air Consumption (SAC) which is a handy value I guess. How it calculates this value I'm not so sure about though but more about that later. What I want to ask is what the pressure graph really means. There are two lines (blue for tank ressure and red for SAC). Here is a screen capture:
Profile.png


But two things about those two lines don't make sense to me. I would expect the blue line not to have an even gradient. I mean, assuming that I breath at the same rate throughout the dive, surely the tank pressure should drop at a quicker rate when I'm deeper down. The other thing is that the red line seems to be roughly inversely linked to the depth, in other words, as the dive gets shallower the SAC increases and as the dive gets deeper the SAC decreases. I would have thought that the deeper I am the higher my SAC would be and vice versa.

What is it that I'm not understanding?

Secondly, the way SDM calculates SAC baffles me a bit. Again, here is a screen capture of the air consumption page.
AirConsumption.png


Apologies for using metric units but I live in the "rest of the world". By my calculations, if I use a 10 liter cyllinder filled to 210 bar (2100 liter) and I get out of the water with 60 bar remaining it means that I used up 150 bar, which multiplied by the 10 liters of cyllinder size gives me 1500 liters. Dividing this by 27 minutes gives me an air consumption of 15.56 liters per minute at depth. Dividing this by the average depth (11m) over 10 plus 1, gives me a SAC of 26.46 liters per minute but according to SDM my SAC is 23.5

I can already see where it's going wrong (or I'm going wrong). According to SDM, the "total gas in cyllinder" is 1981.1 liters (huh? this should be 2100 liters) and the "volume gas used" is 1374.5 (huh? this should be 1500).

Any ideas what's up here?
 
The blue line is just a linear representation of the two points you entered (starting pressure and ending pressure). It doesn't represent actual gas usage -- if you think about it, you only entered two data points so how could it?

You might be able to get an accurate overall SAC number but since the chart is extrapolating your tank pressure dropping in a straight line, the SAC calculation at any given point in your dive is a meaningless number.

If you had an air-integrated computer (which I personally wouldn't touch with a ten-foot pole but that's just me), you might be able to get a somewhat more accurate number. Really its the overall number that counts anyway.

FWIW, just another heads up in case you haven't come across this, many Suunto computers that capture temperature do a similar calculation using the starting temp and the coldest temp. Although they can track water temperature in real-time on the display, many of the computers only have two locations to actually store the data. Weird, huh?

Suunto, Replacing Luck! :wink:
 
FWIW, just another heads up in case you haven't come across this, many Suunto computers that capture temperature do a similar calculation using the starting temp and the coldest temp. Although they can track water temperature in real-time on the display, many of the computers only have two locations to actually store the data. Weird, huh?

Actually it depends on the dive profile; generally you're correct only "few" points (not always 2 - I have a stinger and have several dives with 3,4 & 5 points on the SW log)are downloaded to the SW the remainder stays on the computer log.

Deefstes:
try to slowdown on egress:wink:
 
Deefstes,

I have been using the Suunto Mosquito for a couple years now. I really like it. I hope that you enjoy it, too.

I agree with everything that John_B states above. The tank pressure and SAC graphs are quite meaningless. The SAC is being calculated for a given time interval. Data used to calculate this value are: the average depth during the interval and amount of air consumed during the interval. As John_B points out, the air consumption graph is linear because only 2 points have been specified. In relation to dive time, your usage of the air is not linear. In fact, you are most likely using more tank air at greater depth -- it's just physics.

Use the one "SAC rate" number that the software calculates...and be happy. :)

Your SAC rate/RMV calculation looks correct. I can only guess that the SDM uses a different "total gas in cylinder" number because the ideal gas law is not linear above 200 bar; thus, the 10L tank at 210 bar will actually hold less than 2100 L of air. Mathematically, I believe that the "correction factor" takes the form of the Van der Waal's equation, representing real gas behavior. The basis for this divergence from the ideal gas law is the presence of van der waal's forces which cause individual molecules to not act independently of one another.

In the end, you can choose to use Suunto's numbers or calculate your own. Either way, you'll be able to chart improvement of your RMV as you become a more experienced diver. You also be able to see how different dive conditions affect your RMV.

Have fun and dive safe.
 
The blue line is just a linear representation of the two points you entered (starting pressure and ending pressure). It doesn't represent actual gas usage -- if you think about it, you only entered two data points so how could it?
OK, that makes sense - your explanation that is but not Suunto's reasoning.

You might be able to get an accurate overall SAC number but since the chart is extrapolating your tank pressure dropping in a straight line, the SAC calculation at any given point in your dive is a meaningless number.
Again, your explanation makes sense, thanks. But how stoopid is that? The software assumes that my tank pressure drops at a constant rate while my SAC rate fluctuates - duh! Why didn't it calculate the fluctuating drop in tank pressure given the constant SAC? A much more likely scenario wouldn't you think?

Here's what I would have expected. I exported the dive profile to Microsoft Excel and made my own graph. The graph shows the dive profile and the tank pressure. I ommited the SAC because it would be a flat line throughout. Notice how the rate of drop in tank pressure is faster during the deeper sections of the dive.
Pressure.png


I know that there are only two values (starting pressure and final pressure) to work from but surely this is a much more accurate approximation than assuming a constant drop in tank pressure? Unless Messr Boyle had it wrong, I'm sucking almost three times as much air from my cyllinder with every breath at 18m than at the surface.

If you had an air-integrated computer (which I personally wouldn't touch with a ten-foot pole but that's just me)
Would you mind telling me why? I'm just curious because I thought it was a neat idea and that, one day, I'd like to get one. Sure, I don't think it should be used to replace your SPG but for retrospective annalysis of a dive I'm sure the information it provides would be interesting at the least and perhaps even useful.

I have been using the Suunto Mosquito for a couple years now. I really like it. I hope that you enjoy it, too.
Absolutely! I think it's a stunning little gadget. The jury is still out on the Suunto Dive Manager software though.

I believe that the "correction factor" takes the form of the Van der Waal's equation, representing real gas behavior. The basis for this divergence from the ideal gas law is the presence of van der waal's forces which cause individual molecules to not act independently of one another.
Very interesting, thanks. I suppose most of these are more academic than useful in practice but I like math and, seeing as I can't dive all the time, I like having an excuse to spend time on diving related issues:D

In the end, you can choose to use Suunto's numbers or calculate your own. Either way, you'll be able to chart improvement of your RMV as you become a more experienced diver. You also be able to see how different dive conditions affect your RMV.
Exactly, that's what I was hoping to achieve. You might notice from the dive profile above that I'm still very much an air hog but I'm working on it and hopefully this data can be useful or at least show me what progress I'm making.
 
Again, your explanation makes sense, thanks. But how stoopid is that? The software assumes that my tank pressure drops at a constant rate while my SAC rate fluctuates - duh! Why didn't it calculate the fluctuating drop in tank pressure given the constant SAC? A much more likely scenario wouldn't you think?

The software does not assume that your tank pressure drops at a constant rate. The software only has two data points to work with - start pressure and end pressure, so it approximates the graph between the known data points. And an approximation between two points is a straight line.

If you had an air integrated computer, the software would have pressure readings at all the depth sample points, so the software would be able to make a fairly accurate SAC calculation at every point of the dive.

Without an air integrated computer, just click the little icon above the graph that hides the SAC part :)
 
The software does not assume that your tank pressure drops at a constant rate. The software only has two data points to work with - start pressure and end pressure, so it approximates the graph between the known data points. And an approximation between two points is a straight line.
Yeah I suppose you're right. I just feel that, if I had written the software, I would have approximated the cyllinder pressure a little bit more intelligently than by just connecting the dots (of which there are only two).

Without an air integrated computer, just click the little icon above the graph that hides the SAC part :)
:)That's one sollution but I feel that, even though there are only two data points available, the software can give you reasonably useful information in the form of a graph. After all, there really is more than just two data points available. It may be true that there are only two cyllinder pressure data points but there are dozens of depth data points which we all know have a significant bearing on air usage.

I think I'd be safe if I claimed that my graph above is far closer to what happened in the real world than Suunto's connect-the-dots graph.
 
Just some fun info, here is a screencap of a recent pool dive I did to work on my skills. I have a D9 so tank pressure was recorded every 20 seconds. You'll notice the SAC drops to zero when I surfaced to mess with my trim weights, and also spiked when I was practicing breathing from a free flowing reg.


I have used SDM for a few years, and I've seen very slow improvements in the software. It still has quite a few flaws, but its good enough for me.
 

Attachments

  • Clipboard01.jpg
    Clipboard01.jpg
    31.7 KB · Views: 163
https://www.shearwater.com/products/swift/

Back
Top Bottom