Deep Stops Increases DCS

Please register or login

Welcome to ScubaBoard, the world's largest scuba diving community. Registration is not required to read the forums, but we encourage you to join. Joining has its benefits and enables you to participate in the discussions.

Benefits of registering include

  • Ability to post and comment on topics and discussions.
  • A Free photo gallery to share your dive photos with the world.
  • You can make this box go away

Joining is quick and easy. Log in or Register now!

Status
Not open for further replies.
Rossh, really all this is covered in great detail on the Rebreatherworld thread. You know this. It's kind of sad because you could be running with this new information from NEDU instead of battling subject matter experts.

I learned a huge amount from the RBW thread for which I am thankful. Also thankful that Drs Doolette and Mitchell actually took time to post both there and here.

Hi, thanks for your comments. We make software to suit both ends of this argument, so pick which ever one you prefer.

But I'm the pedantic type, and won't accept this Nedu test explanation fallacy. Truth be told, the nedu test is more critical of modified shallow stops than anything else.

For professional reasons of integrity, Simon and David will never publicly admit to any fault or errors in the test or the explanations they provided.

The RBW thread degraded into a slinging match of trolls, giving us made up test methods and fabricated data. We were bombarded with meaningless eye candy graphs ad-nauseam. It sounds more like a marketing and advertising campaign - coincidentally, these were the occupations of two of the primary antagonists.

******

What I'm asking is you take a fresh hard look at the details above. If you find fault with the above, then lets here it. Otherwise, you may have to concede (privately if you wish), that the nedu test does not fit into real experiences, the explanations given for the nedu test outcomes are wrong or invalid, and the test says nothing about deep stops. And if that's the case, then have a little think about the other "growing evidence" claims we are being fed.
 
I know that I'm a relatively young, relatively fit diver without a PFO who does a lot of longer dives well below 200' and often below 300'. I know from some unpleasant experiences that despite a moderate to high level of conservatism, VPM-B/E leaves me feeling like :censored: after dives much deeper than 200' and/or with more than a hour or so of deco hang, unless I put a 70% GFS on top of it. And I know, having been prompted to experiment by commentary and debate, that limiting the % of helium in my algorithm and running 60/85 GFs leave me feeling a heck of a lot better. Others are putting in 0% helium and diving 85/90 and feeling good; still others report great success with straight VPM models in deeper dives and longer hangs than I'm currently doing.

Everyone else's mileage may vary, but quibbing over exactly what the NEUD study does or doesn't show seems like obfuscationary bull:censored:.

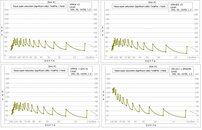
Here is a collection of supersaturation pressure graphs through the ascent for a number of different planning methods described here. Using a 250 ft 30 min 10/50 1.2 plan.

250-30-samples.jpg

The first three are very simuilar VPM-B, B/E, GFS and the last is GF 60/85. The GF 60/85 allows high supersaturation's to occur, while the VPM types control it better across the whole dive. The interesting part is they all finish the dive with about the same level of supersaturation.
 
For professional reasons of integrity, Simon and David will never publicly admit to any fault or errors in the test or the explanations they provided.

This is completely out of line and demonstrably untrue. For example, arguably the single piece of work I am best known for was the original study demonstrating brain protection by lidocaine in humans, published here:

Mitchell SJ et al. Cerebral protection by lidocaine in cardiac operations. Ann Thorac Surg. 1999 Apr;67(4):1117-24.

Ten years later I published a second study that in large part contradicted my original one, published here:

Mitchell SJ et al. Cerebral protection by lidocaine during cardiac operations: a follow up study. Ann Thorac Surg. 2009 Mar;87(3):820-5

How does that fit with your insinuation that I won't change my mind in the face of new evidence, or that I would publicly suppress truth or facts that contradict my work? David is no different. Quite frankly, you should be ashamed of yourself.

As for the rest of it, the others are correct: it has all been addressed elsewhere. Your peak supersaturation graphs are just a distraction. Yes, of course peak supersaturations in fast tissues are higher in shallow stop profiles. But the point you completely fail to grasp, and the one elegantly demonstrated by the NEDU study, is that this does not seem to matter clinically. What appears important (based on the hard outcomes of that study) is the increased integral of supersaturation and time (which your graphs do not show) later in the ascent in the slower tissues that continue to take up gas during deep stops. This principle has been independently demonstrated recently by an increase in DCS rates precipitated simply by longer flights in a low pressure aviation setting.

Simon M
 
Here is a collection of supersaturation pressure graphs through the ascent for a number of different planning methods described here. Using a 250 ft 30 min 10/50 1.2 plan.

View attachment 203713

The first three are very simuilar VPM-B, B/E, GFS and the last is GF 60/85. The GF 60/85 allows high supersaturation's to occur, while the VPM types control it better across the whole dive. The interesting part is they all finish the dive with about the same level of supersaturation.

No, the interesting part is none of these charts are tracking the tissue saturation that seems to be causing problems - I'm not aware of anyone reporting Type II nervous system niggles. Whatever "VPM types control . . . better across the whole dive" isn't doing much for quite a few of us. But good luck with your continued algorithm sales.
 
your toasted, rossh :( . I have a scientific background myself and your way of criticising others does not give you credit in this post. Your science looks really financially biased :). Sorry to see this. Freewillow, Ph.D.

user-offline.png
 
Being pedantic may be an impediment in this case.
 
No, the interesting part is none of these charts are tracking the tissue saturation that seems to be causing problems - I'm not aware of anyone reporting Type II nervous system niggles. Whatever "VPM types control . . . better across the whole dive" isn't doing much for quite a few of us. But good luck with your continued algorithm sales.

Dr. Lecter,

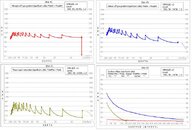
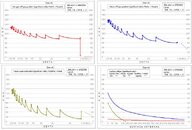
OK.. you want to see the tissue pressure off gassing graphs? .... here you go. Note that our graphs only show the important bit - the values when pTissue > pInspired - the part when off gassing occurs. Other programs show total on/off gas charts that are 90% meaningless noise.

I have added the surface off gas condition charts too. These features are inbuilt to our MultiDeco program.


vpm_b-e.jpg gf65-85.jpg
left VPM-B/E + 3, right ZHL- C GF 65/85


You can see the tissue pressure off gassing follows the supersaturation pattern. Here with this CCR profile the ratio of inspired mix remains constant, and that translates to the same supersaturation information. An OC dive with changing mixes, makes a more complex picture.

Also see how the surface off gas is very similar. The only notable difference is the deeper stop dive, has a longer lasting supersaturation period (20 mins). For all the noise and fuss we get from Simon on this, that is the actual difference in the surface conditions. If that makes any meaningful difference, I'd be surprised.

The major difference between VPM and ZHL is the emphsis on the initial supersaturation and off gas rate values. ZHL lets it all spike very high, while VPM controls this through the whole ascent.

If you want or need to see the purely meaningless "mb/mins" nonsense time measure, then just shade in the area below the line on the graph, and zoom the graph width to match the same dive time.
 
Last edited:
. I have a scientific background myself and your way of criticising others does not give you credit in this post. Your science looks really financially biased . Sorry to see this. Freewillow, Ph.D.

I have been supplying top quality deco products to the community for 15 years now. I make and sell software for both sides of this argument. You claiming its all about money is plain wrong, and an insult to my integrity. I like to get down to the facts of this tests, because I have an strong interest in this subject. The commentary being offered by others on the Nedu test does not fit with the facts, and we are demonstrating that. I'm sorry that you may find that unusual or unacceptable.

Sadly that process of fitting this Nedu test result into the big picture and giving us some context, seems to have been overlooked. In its place, we have a "leading expert" just making stuff up to fit a position he has been pushing since 2008.


As for the rest of it, the others are correct: it has all been addressed elsewhere. Your peak supersaturation graphs are just a distraction.

Simon M


Are you joking? You might like to re-read the TR 11-06 Nedu report to which you repeatedly refer. The significance of supersaturation is paramount to decompression. From the Introduction by David:

"During subsequent ascent to sea level, the ambient barometric pressure (Pamb) may decrease to a level less than the sum of the partial pressures of all n gases dissolved in a particular tissue. In this state the tissue is gas supersaturated by an amount equal to the difference, Sptisj - Pamb > 0, for j=1, …, n dissolved gases. The gas supersaturated state may be sustained metastably until relieved by physiological washout of gas via the blood and lungs, or may be relieved by in situ formation of bubbles from the excess dissolved gas. The risk of DCS is thought to depend on the size, profusion, and location of such bubbles."


Yes, of course peak supersaturations in fast tissues are higher in shallow stop profiles. But the point you completely fail to grasp, and the one elegantly demonstrated by the NEDU study, is that this does not seem to matter clinically. What appears important (based on the hard outcomes of that study) is the increased integral of supersaturation and time (which your graphs do not show) later in the ascent in the slower tissues that continue to take up gas during deep stops. This principle has been independently demonstrated recently by an increase in DCS rates precipitated simply by longer flights in a low pressure aviation setting.

Simon M


The supersaturation you talk about is almost non-existent in the higher risk profile. See the diagram. The A2 test has the lowest amount of supersaturation, and lowest amount of nonsense mb/mins.
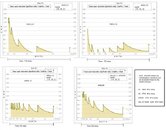


nedu_ss-compare2.jpg

Note: We scaled these graphs to meet this nonsense timed basis mb/min measure. The filled-in area below each graph shows that amount. Note how the highest one is the A1 plan. The lowest is the A2 "high risk" plan. Where is this "increased integral of supersaturation and time", that you speak of? It ain't there Simon.

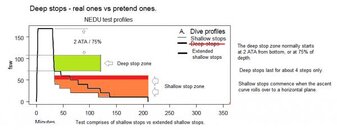
These nedu test profiles have been elongated in the shallow stops so much, that supersaturation has been severely reduced. Any normal dive we do today has much higher super saturation levels than these test profiles.

nedu_deepvpretend.jpg


The Nedu test method was one of manipulating shallow stops excessively longer. Strangely, that is the same as your current recommendation - longer shallow sections.

That is the hypocritical aspect of all this:

These test profiles should have been fantastically safe by ZHL / GF standards. They have more than double the shallow stop time needed. They use the same method we apply to all dives to reduce risk - that is: to make it safer, go longer in the shallow parts. But both these test profiles have unusually high injury levels. Is there some kind of reversal in the added safety method? Or has some other outside influence increased the risk?

An astute scientist would see the anomaly here, and seek out other factors to attribute to the cause of injury.


But your "plausible explanation" gives the cause as supersaturation (that's almost non-existent) and from deep stops (that don't exist). Sorry, but your explanations do not pass analysis Simon.
 
Last edited:
In its place, we have a "leading expert" just making stuff up to fit a position he has been pushing since 2008.

Well there's a coincidence. 2008 was around about the time that solid evidence emerged that bubble models might not be the best approach. Up until then, this "leading expert" was using your model for all his diving, but on the basis of emerging best evidence decided to make a change.

Are you joking? You might like to re-read the TR 11-06 Nedu report to which you repeatedly refer. The significance of supersaturation is paramount to decompression.

Of course it is, but it really is a concern that you don't appear to understand my point. I am not saying supersaturation does not matter. I am saying (based largely on the results of the NEDU study) that transient high / peak supersaturation in fast tissues does not seem to matter as much as we thought it might, and therefore that protecting fast tissues from supersaturation early in the ascent by using deep stops does not seem as effective as assumed by bubble models. This is especially so when it comes at the cost of increased supersaturation (both in terms of peak levels and duration) in slower tissues later inthe ascent. The NEDU study is telling us that this is where the problems seem to come from.


The supersaturation you talk about is almost non-existent in the higher risk profile. See the diagram. The A2 test has the lowest amount of supersaturation, and lowest amount of nonsense mb/mins. Note: We scaled these graphs to meet this nonsense timed basis mb/min measure. The filled-in area below each graph shows that amount. Note how the highest one is the A1 plan. The lowest is the A2 "high risk" plan. Where is this "increased integral of supersaturation and time", that you speak of? It ain't there Simon.

Ross, the answer is there.... right in your own graphs. The graphs are flawed in that unlike Kevin's heat maps they don't clearly demonstrate what is happening after surfacing (probably the most important period of supersaturation in slower tissues) and they don't clearly distinguish tissues, but they nevertheless illustrate the important principles. They show that the NEDU deep stops profile (A2) did reduce supersaturation in the faster tissues early in the ascent. But even with the post-surfacing data cut off (why did you do that Ross?) it is actually clear (from your own graphs and contrary to your "it ain't there" claim above) that there is greater supersaturation in in the slower tissues later in the ascent. If protecting fast tissues from supersaturation early in the ascent is so critical to decompression efficacy (as fundamentally assumed by bubble models) why did the profile that achieved that result in most DCS? The answer is that the problems are arising from slower tissues exposed to more sustained supersaturation later in the ascent (as shown in your own graphs).

These test profiles should have been fantastically safe by ZHL / GF standards.

And how would you know that Ross? Where is your database of carefully standardized ZHL / GF air dives to 170' for 30 minutes with air decompression, high work loads and realistic thermal stress all with prospectively measured hard outcomes? That's what you need to justify such a claim and you don't have it. The US Navy has extensive data from testing programs and real world diving that suggest decompression requirements for these dives in the "ball park" range used in this study. As David has suggested to you previously, you would be welcome to use less conservative decompressions: just expect more problems.

Simon M
 
. . . I am saying (based largely on the results of the NEDU study) that transient high / peak supersaturation in fast tissues does not seem to matter as much as we thought it might, and therefore that protecting fast tissues from supersaturation early in the ascent by using deep stops does not seem as effective as assumed by bubble models. This is especially so when it comes at the cost of increased supersaturation (both in terms of peak levels and duration) in slower tissues later inthe ascent. The NEDU study is telling us that this is where the problems seem to come from. . .
No objection to this conclusion Simon, but I want to know why it is so and what you think is physiologically going on . . . vis-a-vis the Fast Tissues. What makes these tissues so "robust" that protecting these fast tissues from transient peak SS "does not seem to matter"?
 
Status
Not open for further replies.
http://cavediveflorida.com/Rum_House.htm

Back
Top Bottom