I am thinking about getting one of the visual indicators like the one in this link:
August Industries - Visual Indicator
August Industries - Visual Indicators
I have two options for the actual indicators disk. They both measure relative humidity. One reads 20, 40, 60% relative humidity and the other reads 10, 20, and 30%.
See the links:
August Industries - Moisture Indicator Disk
August Industries - Moisture Indicator Disk
In the links, it recommends to use the 20, 40, 60% relative humidity (RH), for normal use, but I would like to see how I can correlate the high pressure RH measurements to the one atmosphere dew point (as normally published).
I assume that I am going to have to know (measure and/or estimate) the air temperature and pressure in the visual chamber to evaluate the RH readings.
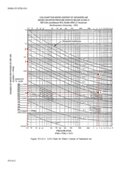
In NSTM 551 (appendix D), I have found the best tables showing moisture content (in PPM) for high pressure air and how it relates to the one atmosphere dew point (plus the actual high pressure dew point). I think I can calculate the relationship between high pressure RH and dew point using the graph below, but I was wondering if there is an easier way.
August Industries - Visual Indicator
August Industries - Visual Indicators
I have two options for the actual indicators disk. They both measure relative humidity. One reads 20, 40, 60% relative humidity and the other reads 10, 20, and 30%.
See the links:
August Industries - Moisture Indicator Disk
August Industries - Moisture Indicator Disk
In the links, it recommends to use the 20, 40, 60% relative humidity (RH), for normal use, but I would like to see how I can correlate the high pressure RH measurements to the one atmosphere dew point (as normally published).
I assume that I am going to have to know (measure and/or estimate) the air temperature and pressure in the visual chamber to evaluate the RH readings.
In NSTM 551 (appendix D), I have found the best tables showing moisture content (in PPM) for high pressure air and how it relates to the one atmosphere dew point (plus the actual high pressure dew point). I think I can calculate the relationship between high pressure RH and dew point using the graph below, but I was wondering if there is an easier way.
Attachments
Last edited: