Deep Stops Increases DCS

Please register or login

Welcome to ScubaBoard, the world's largest scuba diving community. Registration is not required to read the forums, but we encourage you to join. Joining has its benefits and enables you to participate in the discussions.

Benefits of registering include

  • Ability to post and comment on topics and discussions.
  • A Free photo gallery to share your dive photos with the world.
  • You can make this box go away

Joining is quick and easy. Log in or Register now!

Status
Not open for further replies.
Heat graphs are NOT decompression information. On / off gassing charts are NOT decompression information. Heat graphs do not show Supersaturation! Once again Kevin, you have confused your terms. your graphs do not show supersaturation.


On / off gassing make pretty charts, but is NOT decompression information.


  1. The colors compare the state of each tissue compartment's supersaturation and continued on gassing relative to the other 4 profiles. So, for example, compartment 10 for A2 is red when the diver surfaces while the other profiles' are shades of red and yellow. The colors roughly show how close each profile's compartment is to the others.
No. Supersaturation is not measured by comparing it to a neighbors value. These chart has no decompression details.


***********************************

Here is a real chart of actual decompression supersaturation limits. This data (actual supersaturation) is superior to on/off gassing data.
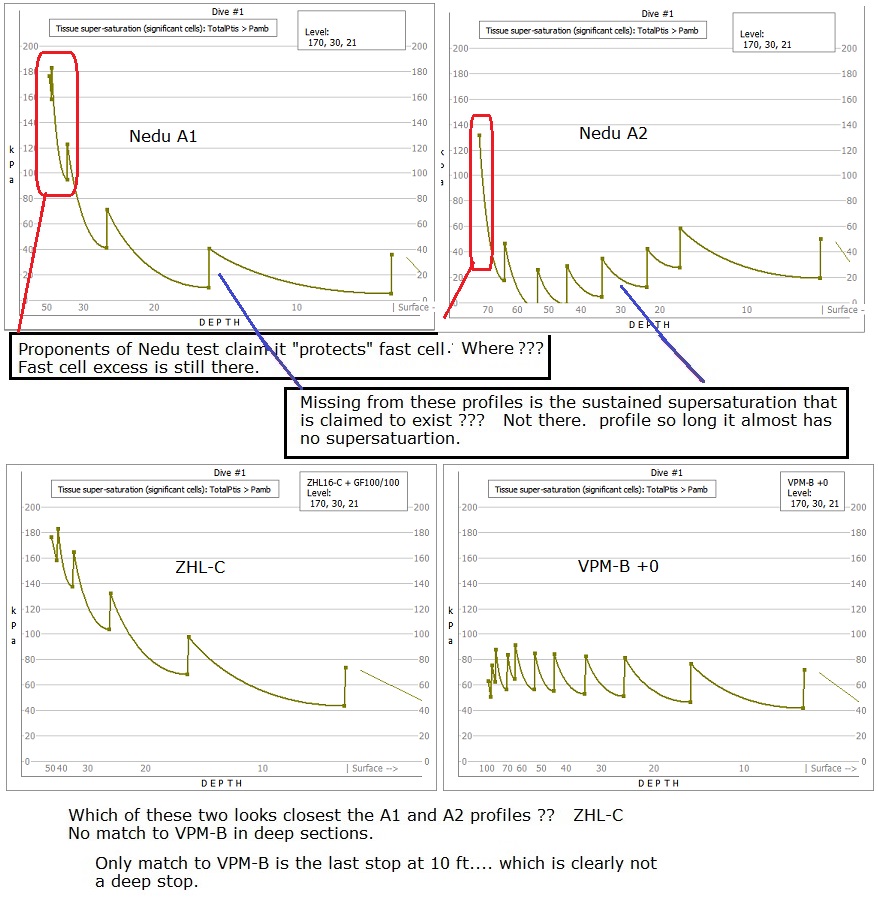

kw_nedu_all.jpg
 
Last edited:
But if they had done 50% less deco on A2 things would have been much better, right? :wink:

All that shallow time will bend you every time

Ignore all references to VPM-B in those diagrams.

There is no such thing as a VPM-B +7. It is FAKE !

They could not make any real connection to VPM-B, so they just made up a FAKE profile.

Pathetic! A deliberate deception.

Ross, seriously just stop.You have done nothing in hundreds of posts over dozens of threads here, on RBW, CCRx, but to alienate people to you position. Give it a rest.
 
Ross, seriously just stop.You have done nothing in hundreds of posts over dozens of threads here, on RBW, CCRx, but to alienate people to you position. Give it a rest.

And they are still FAKE profiles - fabricated nonsense to make a point, that does not exist. A straw man argument.

This is supposed to be a science, not fantasy, not fallacy.

Why should anyone tolerate such deliberate efforts at deception? Tell me? Why should we have to put up with this?

.
 
Last edited:
Ignore all references to VPM-B in those diagrams.

There is no such thing as a VPM-B +7. It is FAKE !

They could not make any real connection to VPM-B, so they just made up a FAKE profile.

Pathetic! A deliberate deception.
If so, the whole world is in on it.

Dr. Doolette referenced this VPM schedule in his presentation here. See minute 36:47.
 
In my table I only use the NEDU result that A2 is worse than A1 in terms of DCS risk. You seem to believe that the thermal stress during the study kind of inverted the order, and that A2 is not worse than A1?

That's interesting, because Bruce Wienke and T.R. O'Leary in their response ("Recent Deep Stop Tests and Data") find that A2 has much higher DCS risk than A1 in RGBM, too. This is a fundamental point in their paper, to show that RGBM estimates the DCS risk in accordance with the NEDU results.

So if you have proof that this is wrong, it would be interesting to see because it pulls the rug from under RGBM.
Hi,

Cam you please direct me to the paper or post with BRW and T.R.O'Leary's responce or where it was published.
 
If so, the whole world is in on it.

Dr. Doolette referenced this VPM schedule in his . See minute 36:47.

He made it up - not used, not available - not realistic, fabricated, cooked it up.

Otherwise known as FAKE.

.
 
Deep stops are just a few extra minutes in the ascent. (110-80ft)
vs
The test did 90+ extra minutes in the mid to shallows. (60-20ft)

The test has no deep stop: Tech models cannot provide the fabricated mid to shallow stop that the test used.

The test was over two times longer than needed.

I don't know why you reply this to my post. I haven't talked about "deep stops". I don't like these terms with no clear definition. There are no "deep stop models" or "shallow stop models". The meaning of "deep stop" is vague (unless we talk about Pyle stops).

The profiles of the NEDU study are indeed different from the optimal profiles of a VPM or ZHL+GF model. So what. Let's just call them A1 and A2 and move on. The more interesting question is, how do A1 and A2 perform when evaluated by ZHL, VPM, RGBM, ...?


***********

Thermal stress is very powerful and can ruin any dive. Please see: The Influence of Thermal Exposure on Diver Susceptibility to Decompression Sickness.

Sure it is. That's why tables created from ZHL-16 had rules how to add conservatism for temperature (and exertion). ZHL-8 ADT considers ambient temperature, resulting in more deco in cold water. Again, calibrated by experiments.
In the VPM-B Fortran code however, I don't see temperature considered, and I'm not aware that anybody ever ran controlled experiments to see how VPM profiles need to be adjusted for cold.
 
Hi, yes I found it in the meantime. It show that the so called "Deep stop" profile from NEDU trial is very different from profiles generated with normal bubble models, such is RGBM. Sure there is much more in that paper and not in favor of the NEDU trial.

Here in attached document you can find Correlation of diving models with computer profile data and outcomes stored in LANL Data Bank. It is a document BRW asked me to post to diving forums when he released it so I repost it once more, as it has some valuable informations.


Attachments

  • model-compare-outcomes_BRW.pdf
    104.1 KB · Views: 192
Status
Not open for further replies.
http://cavediveflorida.com/Rum_House.htm

Back
Top Bottom