


UWSojourner
Contributor
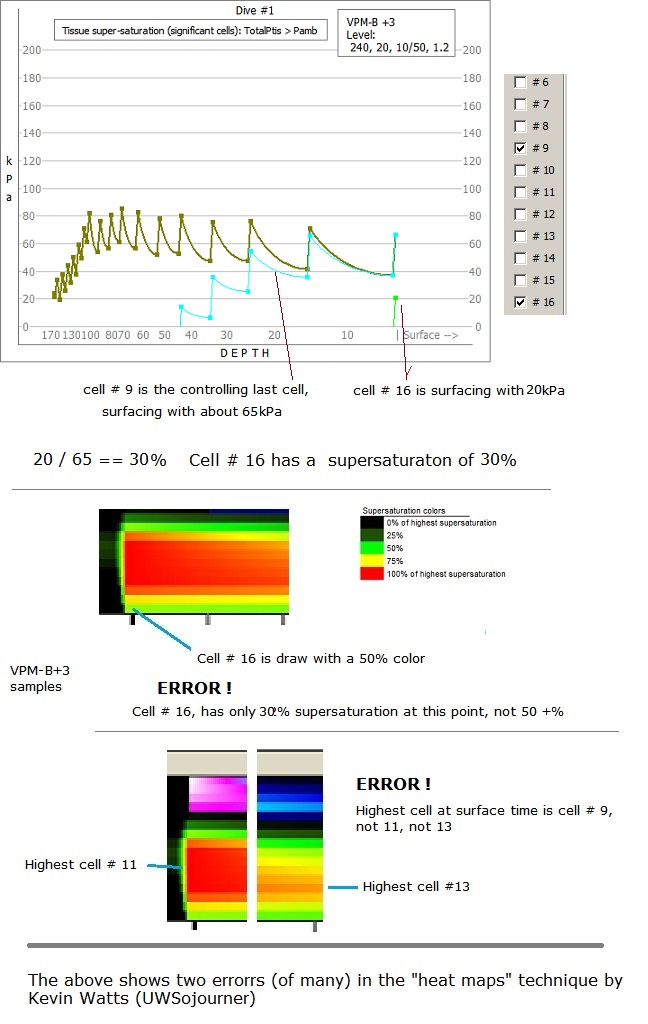
You're wrong. The heat map maps SUPERSATURATION.But these heat graphs of Kevin, only show / on / off gassing. That's interesting, its tissue gradients, or tissue saturation, but NOT supersaturation not decompression limits, not how deco is calculated.
Tissue gradients are 90% noise, they go up they go down, but that is not decompression or supersaturation information.
")

