Deep Stops Increases DCS

Please register or login

Welcome to ScubaBoard, the world's largest scuba diving community. Registration is not required to read the forums, but we encourage you to join. Joining has its benefits and enables you to participate in the discussions.

Benefits of registering include

  • Ability to post and comment on topics and discussions.
  • A Free photo gallery to share your dive photos with the world.
  • You can make this box go away

Joining is quick and easy. Log in or Register now!

Status
Not open for further replies.
For starters, ideally we need a better correlative pathophysiological DCS marker than VGE scores by Doppler Ultrasound, and more ethical than eliciting acute prompt or delayed DCS symptoms. As for experimental design, that's something that Ross & Simon, or Bruce Wienke & David Doolette have to debate and agree upon.

We're still waiting on the publishing of the results of the Ratio Deco vs 30/80 GF Buhlmann study, and to see whatever relevance that paradigm has at all. . .
 
Last edited:
We're still waiting on the publishing of the results of the Ratio Deco vs 30/80 GF Buhlmann study, and to see whatever relevance that paradigm has at all. . .

I've voiced my concerns about this before. He's using gradient factors that have fallen out of favor AND adding deep stops arbitrarily because diving without deep stops is "obviously far too dangerous." it's about as unscientific as it gets.
 
So I would like to repeat the challenge to the more scientific-minded people reading this thread. Let's start from scratch. Let's say you want to do a good, sound investigation of the efficacy of deep stops. You want to make sure that you are studying the efficacy of deep stops and not some other part of the entire decompression process. How would you do it? what would you do differently from the NEDU study, and why would you do it that way? Please be specific.

The issue I have is that the NEDU study was one dimensional. It used very long deco profiles to supposedly validate which stop philosophy was more efficient. The problem is that deco isn't linear, in that you can not do deep stops for the extremely exaggerated times that they did efficiently(you on gas too damn much). In my opinion, the outcome was a given...the profile with more time spent deep (considering the lengthy stops) produced more DCS.

If I were to suggest a way to re-evaluate this study, I would do a couple of things differently.

First and foremost I would have run 3 profiles....A1, A2 and Bruce's profile that got ****canned.

Second, I would run the test with an opposite end of the spectrum to evaluate....in that I would like to see the same bottom time with light exertion, and a +0 modifier of the algorithms. Run straight Buhlmann, Straight Navy bubble and Straight RGBM.


Unfortunately certain people think that the NEDU Study shows "CLEAR" evidence that deep stop profiles are inferior to traditional dissolved gas models. Its just not true. They merely didn't test the whole spectrum, and they deliberately ignored the reality that you cant do a "Deep Stop" for 20 minutes.....its counter productive....Deep Stops are meant to be brief, so that you can protect the fast tissues, and minimize additional ongassing in the slow tissues....There has to be a balance, and NEDU's parameters ignored that completely.
 
Low is bad, high is good. It's an inverse measure. That's the problem when you just "make stuff up" Simon. The way you guys add up 16 concurrent values is flawed, and it includes harmless levels of surface off gassing. This "integral of supersaturation" is worthless as a measure, and in any case, it demonstrates VPM to be the safer approach. But then, I'm more intelligent that to get suckered into this "integral of supersaturation and time" nonsense.

There is the DCIEM tables. These were created by Canadian DRDC, including VGE correlations, and man tested, with known pDCS risks. The DCIEM tables are widely approved for commercial and government work. This DCIEM table prescribes a deco time of 77 minutes, vs the 174 of the nedu test. The nedu test is 2.25 times longer than needed. The astute scientist would see the anomaly of the nedu test results, and realize it's out of context with the bigger picture.

Your "Integral of supersaturation and time", or mb/mins is a inverted measure - remember? Don't shoot your foot off Simon. The diagram shows VPM has the lowest stress and is the better choice.


View attachment 204156


Driving, flying and skiing have less stress than scuba diving, and the diagram shows that - because mb/min is a inverse measure - low is bad, high is good. But in reality, "Integral of supersaturation and time" and the way you try to apply it as some overall measure, is junk science.

Ross

I have been reading this thread quietly, but you have just crossed a line, a result of which I cannot stay silent. You are completely misrepresenting the use of, and the utility of, the summed integral supersaturation as a measure of decompression stress. Your misdirection, that summed integral supersaturation is “an inverse measure” and “Low is bad, high is good”, is the exact opposite of how this useful index of decompression stress should be interpreted, and if your misdirection is followed by divers, could result in their harm.

This misdirection might be forgivable if it arises from ignorance, and it would not surprise me if you are ignorant of probabilistic decompression modeling, the seminal development in decompression theory in the last 30 years, and a development in which integral supersaturation figures largely. However, since integral supersaturation forms part of calculations in VPM, I can only assume you are willfully misdirecting the readers to try to win an argument with Simon. Readers should be aware that the internet is full of bad information. However, because you produce decompression software, some readers might be under the misapprehension that you speak with authority on matters of decompression theory. Because of this, your willful misdirection is unconscionable, and you should be ashamed of yourself.

The time integral supersaturation is used as an index of decompression stress because both the magnitude and the duration of supersaturation are important. The magnitude of the supersaturation determines the probability or rate of bubble formation, so the longer the duration of supersaturation, the more bubbles form. Supersaturation is also positively, linearly related to the net tissue-bubble gradient of inert gas partial pressures, which determines bubble growth, so generally the longer the duration of supersaturation, the larger bubbles grow.

The raw summed integral supersaturation, as it was used in the NEDU Deeps Stop report (NEDU TR 11-06, of which I am a co-author), and mentioned on this and other threads, was used to compare dives of equal duration – there was no attempt to apply it as “an overall measure”. The raw values can give some incongruous results if used to compare vastly different profiles. It is you, in trying to discredit it, who apply the integral supersaturation “as an overall measure” by comparison of exposures of different durations and comparison between hyperbaric and hypobaric (there are no decompression models that appropriately describe the risk of both hyperbaric and hypobaric exposures). Nevertheless, I am not convinced by the numbers you present because you do not detail how they were derived. What compartments were used? Did you sum the values from the compartments, as is appropriate? I suspect not because you have stated that “The way you guys add up 16 concurrent values is flawed”. In fact, adding together the integral supersaturation from each compartment is an essential aspect of the measure. The integral supersaturation is a measure of the risk of injury in that compartment, that risk does not go way just because, for instance, the supersaturation is greater in another compartment.

You state, in the legend of your figure nedu_pg2a_50.jpg in post #388, “Integral supersaturation is not a recognized, or verified, or useful measure in decompression.” This is just wrong. The integral supersaturation is the essence of many U.S. Navy probabilistic decompression models, there must be at least 30 research reports describing how such models provide good descriptions of the incidences of DCS in large data bases of dive profiles and known DCS outcomes, and such a model underlies the extensively validated U.S. Navy MK 16 MOD 1 He-O2 decompression tables. In such models, the probability of decompression sickness (PDCS) is calculated as PDCS=1-exp(-(intRSS[1]+intRSS[2]+intRSS[3])). intRSS is the time integral of the relative supersaturation (RSS) and the numbers inside square brackets indicate different compartments. PDCS goes up as the sum (across compartments) of the time integral of relative supersaturation increases. RSS=(SS-THR)/Pamb, where SS is the supersaturation (Pamb-Ptis), Pamb is ambient pressure , and THR is a threshold. THR, as well as the half-time for the compartments are found by fit of the models to large databases of dive profiles with known DCS outcome. The fitted value of THR is typically very near zero or zero. In NEDU TR 11-06, in the defined and constrained use of the raw integral supersaturation to compare dive profiles of equal duration, and to illustrate a point, we chose not to use THR because it is typically zero, and we chose not to divide SS by Pamb because that penalizes deep stops schedules, which have more of their integral supersaturation at lower Pamb (and therefore greater RSS).

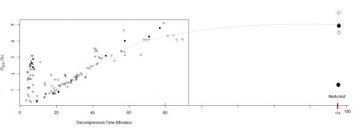
The figure below illustrates that this function of the summed integral supersaturation is a “verified” and “useful measure of decompression”, but also addresses another plank of your argument against the NEDU deep stops experiment.

DC4wPDCS.jpe


This figure shows the risk of decompression sickness (PDCS) for some air dives conducted at DCIEM. PDCS is estimated using the U.S. Navy probabilistic decompression models that underlies the U.S. Navy MK 16 MOD 1 He-O2 decompression table. The dives in the figure were conducted at DCIEM in cold water with divers wearing dry suits, with divers working on the bottom and resting during decompression. The dives in the figure were principally conducted during the development and validation of the DCIEM air decompression tables. The figure represents many different combinations of depths and bottom times. The x-axis shows the decompression time for the dives, the y-axis shows the estimated PDCS of that dive profile. Each point represents usually two (but 1-4) man-dives. The open circles are man-dives that did not result in DCS. The filled circles are dives where one of the divers got DCS.

The first thing to note about this figure is that the highest incidence of DCS (more DCS in fewer man-dives) occurs where the estimated PDCS is high and therefore where the summed integral supersaturation is high.

The second point I want to make about this figure is to address the contention that the NEDU deep stops trials air decompression schedules for 170 fsw / 30 min BT (170/30) were unrealistically long because the DCIEM air tables prescribe 77 minutes air decompression time or the new U.S. Navy Air Decompression Table prescribes 93 minutes air decompression.

What you appear not to understand is that different decompression schedules prescribed by the same deterministic algorithm (such as the USN VVal-18M, DCIEM air decompression model, VPM, ZH-L16 etc.) do not have the same risk of DCS. The dives in the figure were principally conducted during the development and validation of the DCIEM air decompression tables (there are a few equipment test dives in here as well). Many of these dives use the schedules that appear in the DCIEM air tables although some are a few minutes shorter (both some that resulted in DCS and some that did not). The group of dives on the left (short decompression times) are mostly no-stop dives – the three DCS in this group are no stop dives from 200-230 fsw. The remainder of the dives have stops, and you can see PDCS scales roughly with the prescribed decompression time (irrespective of the depth and bottom time). This is typical of deterministic decompression algorithms. Note that the highest incidence of DCS (more DCS in fewer man-dives) occurs for the dives with the longer decompression times. These are the sort of decompression schedules (and the associated predicted and observed incidences of DCS) that you are saying are “realistic” and compared to which the NEDU “test used 2x (double) the required time”.

This is not a criticism of the tables. The developers of these tables understand that the longer schedules have higher risk of DCS, for instance the 170/30 air decompression schedule has higher PDCS than the 170/15 air decompression schedule. They also understand that the 170/30 air decompression schedule has a higher PDCS than the 170/30 oxygen decompression schedule. That is why they impose limit lines. In the USN Diving Manual, short air decompression is allowed, long air decompression is not. The 170/30 air decompression schedule shall not be used; this dive must be planned with the lower risk oxygen decompression schedule. The DCIEM tables are a bit more permissive, 170/30 air decompression is allowed but 170/40 must be conducted with oxygen decompression. The long air schedules are provided principally as a safe way out in the event of loss of oxygen supply, but are recognized to have a high PDCS. This fact is accepted in operational risk management, better to get out of the water quicker than spend the much longer times required to make a substantial reduction in PDCS. However, in the experimental setting of the NEDU deep stops trial, these much longer times were exactly what we needed, for the reasons described in post #377.

David Doolette
 
Well Simon, *IF* you actually looked into the proper causes of stress and injury in the nedu study, and tried to fully explain the anomaly of the nedu test, then you would see how stretching out models and profiles to ridiculous amounts, is a foolish way to compare.

I have spent most of my career researching the causes of stress and injury in DCS. I think I have a reasonable appreciation of it.

The logic behind the NEDU test profile design, and the fact that the profiles were the product of a consensus conference of leading decompression experts is fully described here:

http://www.scubaboard.com/forums/te...ps-increases-dcs-post7353440.html#post7353440

Those eye candy heat maps is 90 % meaningless noise, and the important data is not visible. But they do make for good advertising and marketing technique to play tricks on people.

Can I remind you Ross, that the only person involved in this debate who is "adverising and marketing" anything is you.

A proper examination of the pressures and stress can be seen in my diagrams below.

Your diagrams are difficult to interpret. It is not clear which compartments you are depicting and how you have treated the data but in any event, at face value, and when comparing VPM 4 vs GF 40/75 your graphs illustrate the same pattern of supersaturation in VPM 4 (less supersaturation during deep stops - presumably in faster tissues, and more supersaturation late and after surfacing - presumably in slower tissues) that was found to be associated with a higher incidence of DCS in the NEDU study. If you are happy continuing to aggressively promote your algorithm as the best choice under those circumstances then there is little else for me to do except scratch my head.


Your "Integral of supersaturation and time", or mb/mins is a inverted measure - remember? Don't shoot your foot off Simon.

I have no idea what you mean by "inverted measure". The integration of supersaturation and time in explaining the results of the NEDU study is not "mine"; Dr Doolette first published that analysis. However its importance is self evident from your own SurDO2 analogy (which I notice you have decided not to mention again since this was pointed out to you). It is also present in the fundamental equations underpinning the model you promote (as has been pointed out to you before).


The diagram shows VPM has the lowest stress and is the better choice.

See above... especially the bit that says: "If you are happy continuing to aggressively promote your algorithm as the best choice under those circumstances then there is little else for me to do except scratch my head".


Driving, flying and skiing have less stress than scuba diving, and the diagram shows that - because mb/min is a inverse measure - low is bad, high is good. But in reality, "Integral of supersaturation and time" and the way you try to apply it as some overall measure, is junk science.

Did you not see the bit where I said:

I am well aware that extremely high tissue supersaturations can produce bubbling and symptoms with almost no delay. I am also aware that very low levels of supersaturation may be sustained for very long periods without the development of problems. However, these facts do not constitute a valid argument against time being important at levels of supersaturation between these extremes.

That's just plain wrong. The fast cells are NOT protected by A2 profile, and A2 does not represent deep stops.

And the comparison in your diagram with two other profiles that were not part of the NEDU study means what Ross? You are exhibiting an extremely naive appreciation of the scientific method. In the NEDU study A2 (deep stops) was compared with A1 (shallow stops) and when you compare those profiles A2 did protect the fast tissues...... yet A1 had the better outcomes. If protecting the fast tissues was somehow the magic bullet in all of this you would NOT have expected that result. This is all fully discussed here:

Deep stops debate (split from ascent rate thread) - Page 108


In summary Simon, many of your points are dead.

Only if you are a deep stop table salesman.


You keep claiming the nedu test represents deep stop profiles when it obviously does not. You make comparisons of conditions, that did not exists. You draw conclusions from assumptions that are not possible. You ignore that the nedu A2 high risk profile is actually a shallow profile. You dismiss the basic math and graphs that clearly show your position is invalid. You use junk science to promote your position. And you push people towards the very conditions that generated the high risk profiles.

All I can say is that I'm in good company.

Simon M
 
Ross

I have been reading this thread quietly.................

David Doolette

Hello David,

Thank you for the comprehensive post.


If you don't like me pointing out Simon's use of junk science, then I suggest you influence him to stop doing it. But trying to bully me out of the picture so Simon and friends can keep his sham presentation going, ain't going to work.


You David, have made popular this, "The integral gas supersaturation" on page 15 of your TR 11-06 Nedu report. I would agree it has some limited value under the correct and controlled conditions. However, it cannot be used universally or freely in the way Simon and friends do, as it gets out of context very quickly, or is abused, which I have pointed out.

BUT you allow / encourage / standby / approve as Simon and friends do use it out of context, or incorrectly, and to use it beyond its useful purpose. These are the ones trying to "... attempt to apply it as “an overall measure”... ". They go on to make eye candy junk science graphs to play trickery on people. It is these people who "...are completely misrepresenting the use of, and the utility of, the summed integral supersaturation as a measure of decompression stress...". Are you happy with that? Perhaps you could put some effort into quashing that aspect. "Because of this, your willful lack of action is unconscionable, and you should be ashamed of yourself". ......

Now that we have the unnecessary tit for tat trading of insults out of the way, lets get to the problem.


**********


"...the magnitude and the duration of supersaturation are important..." This is the information that Schriener and Haldane equations provide. Those equations give us 16 sample tissue pressures at any moment in time. From that information, many deco models calculate maximum supersaturation and ascent limits are created. The "duration" component is already included i.e. "time" is already provided by the current sustained maximum value.

Deco models already use the supersaturation information to compute ascents. For example, If a diver extends the time at any given point, the maximum tissue pressure will rise, the time to restore equilibrium will grow, and the deco model will recompute and prescribe a longer deco time. ie. the maximum value in those cells will have risen - the increased supersaturation duration has increased the deco. The process works...

So why do we need a second derivative of the primary measure, this "integral of supersaturation" to account for "duration", when both these components are addressed already? What these guys are attempting is to double up on the time component (or replace it) by adding up individual time slices.


Depending on what Simon and friends feel like on the day, they will add up 16 concurrent cell values spaced across the entire exposure, or use tissue gradients instead of actual supersaturation, to arrive at some giant number to prop up the examples. That's invalid. That method puts more weight on the least significant cells, at the expense of the significant ones. It's the "tail is wagging the dog" effect.

No matter which way you cut it, the measure is an inverted one. For any one dive profile, a Super fast (missed) deco dives, have lowest values for integrals of supersaturation, but high supersaturation peaks, that will dissipate more quickly. Simon argues that peaks don't count, but clearly this dive example indicates that supersaturation peaks are the most significant aspect. It also demonstrates that "integral of supersaturation" is not a useful formula to use here.


David, you let these guys loose to just make stuff up, and that's what they have done. No control or limits or rules to define the proper use of this integral of supersaturation or its components. While they keep posting junk science, I'll keep pointing that out.


**********


The discussion of pDCS across deco times is interesting. There is a rising risk as deco time increases. But at some point it seems to flatten out.

nedu_pdcs-v-all.jpg


Here we see the A1 and A2 profiles added. The pDCS for these was 4.429% and 5.880% according to NMRI98. The BVM(3) predicted the reverse, and was shown to be wrong by the result. The results are plotted too.

Also why wasn't this nedu test method aborted, when its clear that the A1 datum profile was way outside the normal pDCS range?

This diagram I think actually strengthens my argument that these profiles should have been super safe by ZHL standards. Clearly the the A1 /A2 profiles were not "at the edge" of deco, so the recorded pDCS has gone way down. Now you just need to properly explain the cause of the non decompression stresses that triggered these results.


Interestingly, while VPM-B and ZHL do not predict pDCS, if you do some forcing of these Nedu plans into VPM-B and ZHL, you get a consistent relationship between output times and native VPM-B / ZHL plans. The point being that even if you force VPM-B / ZHL to do these elongated plans, they will provide plans that seemingly properly account for the extra on /off gas changes during these shallow stops test.
 
Last edited:
Rossh, remind us of your research credentials please.
 
Rossh, remind us of your research credentials please.

The study is smoke and mirrors and well beyound what anyone would actually dive. Its a long multi-level profile that they call a deep stop model (VPM).

Now its become a cut and paste mudslinging contest about who's the more knowledable camp. This is no suprise as nobody in this industry will agree on anything. One thing I will agree on is that these so called EXPERTS act worse that highschools girls. The level of professionalism is just pathetic.

I dive VPM-B and feel fantastic after all my dives. I have also used GF and also feel fine. I trust VPM and it works great for me and many others.
 
"...the magnitude and the duration of supersaturation are important..." This is the information that Schriener and Haldane equations provide. Those equations give us 16 sample tissue pressures at any moment in time. From that information, many deco models calculate maximum supersaturation and ascent limits are created. The "duration" component is already included i.e. "time" is already provided by the current sustained maximum value.

Deco models already use the supersaturation information to compute ascents. For example, If a diver extends the time at any given point, the maximum tissue pressure will rise, the time to restore equilibrium will grow, and the deco model will recompute and prescribe a longer deco time. ie. the maximum value in those cells will have risen - the increased supersaturation duration has increased the deco. The process works...

So why do we need a second derivative of the primary measure, this "integral of supersaturation" to account for "duration", when both these components are addressed already? What these guys are attempting is to double up on the time component (or replace it) by adding up individual time slices.


You appear to be describing how a decompression algorithm prescribes a schedules, this is irrelevant to the use of the integral supersaturation to evaluate that schedule. The integral supersaturation is an “algorithm-independent” way to look at the magnitude and duration of supersaturation of a schedule prescribed by any algorithm, it is unrelated to how that schedule was prescribed. There is no “doubling up of time.


The discussion of pDCS across deco times is interesting. There is a rising risk as deco time increases. But at some point it seems to flatten out.


View attachment 204241


Here we see the A1 and A2 profiles added. The pDCS for these was 4.429% and 5.880% according to NMRI98. The BVM(3) predicted the reverse, and was shown to be wrong by the result. The results are plotted too.

Also why wasn't this nedu test method aborted, when its clear that the A1 datum profile was way outside the normal pDCS range?

This diagram I think actually strengthens my argument that these profiles should have been super safe by ZHL standards. Clearly the the A1 /A2 profiles were not "at the edge" of deco, so the recorded pDCS has gone way down. Now you just need to properly explain the cause of the non decompression stresses that triggered these results.


Your addition to my figure is inappropriate. My figure illustrates the relationship between prescribed decompression time and estimated PDCS for one particular decompression algorithm - in this case the DCIEM air decompression model (the figure is not perfect because it includes some development schedules). Pasting on points from schedules calculated with a vastly different algorithm, as you have done, is not meaningful. A plot similar to the one I showed, but for the VVal-18 algorithm (which is where the 174 minutes comes from) shows relatively linear increase of PDCS with VVal-18 prescribed decompression time to and beyond 174 minutes with no flattening out. Such a figure appears in Gerth and Doolette, VVal-18 and VVal-18M Thalmann Algorithm air decompression tables and procedures, NEDU TR 07-09, 2007 (page 12).
 
A couple of good questions at this point might be:

1) what is integral supersaturation? and

2) why does Ross seem desperate to discredit integral supersaturation?

What is integral supersaturation (ISS)?

Integral supersaturation is a pretty simple concept. Decompression sickness occurs due to the release of dissolved gases after a dive. How many bubbles will form and how big they get is a function of 1) the speed of the release (that's the pressure of the gases being released), and 2) the time those pressures are allowed to exist. Higher pressures can be endured for a short time and lower pressures for a longer time. The thing to remember is that the TIME you're exposed to supersaturation is important.

ISS is a measure of the speed and time of decompression. Simply looking at charts of peak supersaturation gives you an idea of speed, but is not a good measure of the overall supersaturation-time you're exposed to. Integral supersaturation measures both pressure and exposure time and so can be thought of as an index of decompression stress (supersaturation pressures you're exposed to and the time you're exposed to them) when comparing dives with a similar run time. Pretty simple idea. Its not the rosetta stone of decompression, but it is an interesting and useful measure as Dr. Doolette has described.

Why does Ross seem desperate to discredit ISS?

Consider the chart below. The chart shows ISS for the dives in the NEDU study with VPM-B+7 and GF 53/53 added. The VPM and GF parameters were chosen to get to the same runtime as the NEDU A1 & A2 profiles.

As noted numerous places by Doolette and others, the only credible explanation for the A1 profile performing so much better than the A2 profile is that the ISS of A1 was significantly lower. As Dr. Mitchell addressed here, even though A1 had much higher early supersaturations, those supersaturations were short in duration. What seems to have been much more significant is that A2 had about 50% more supersaturation-time exposure once the diver surfaced.

Now compare VPM and GF on the chart. It's pretty obvious that VPM and A2 (the higher risk profile) are closer; GF and A1 (the lower risk profile) are closer together. And that pattern of significantly more supersaturation exposure upon surfacing doesn't end with the NEDU study. See the charts here and here.

So Ross wants ISS to go away because ISS seems to indicate VPM (and other bubble models) behave more similarly to the A2 profile shown to be more risky in a very closely monitored study of actual dives performed by the US Navy. Its that simple. For some other similarities see here.

A very good discussion of this topic by Dr. Doolette can be found here. Its worth the time.
 

Attachments

  • NEDU ISS.jpg
    NEDU ISS.jpg
    25.3 KB · Views: 364
Status
Not open for further replies.
http://cavediveflorida.com/Rum_House.htm

Back
Top Bottom