Ross
I have been reading this thread quietly.................
David Doolette
Hello David,
Thank you for the comprehensive post.
If you don't like me pointing out Simon's use of junk science, then I suggest you influence him to stop doing it. But trying to bully me out of the picture so Simon and friends can keep his sham presentation going, ain't going to work.
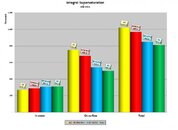
You David, have made popular this,
"The integral gas supersaturation" on page 15 of your TR 11-06 Nedu report. I would agree
it has some limited value under the correct and controlled conditions. However, it cannot be used universally or freely in the way Simon and friends do, as it gets out of context very quickly, or is abused, which I have pointed out.
BUT you allow / encourage / standby / approve as Simon and friends do use it out of context, or incorrectly, and to use it beyond its useful purpose. These are the ones trying to
"... attempt to apply it as “an overall measure”... ". They go on to make eye candy junk science graphs to play trickery on people. It is these people who
"...are completely misrepresenting the use of, and the utility of, the summed integral supersaturation as a measure of decompression stress...". Are you happy with that? Perhaps you could put some effort into quashing that aspect. "
Because of this, your willful lack of action is unconscionable, and you should be ashamed of yourself". ......
Now that we have the unnecessary tit for tat trading of insults out of the way, lets get to the problem.
**********
"...the magnitude and the duration of supersaturation are important..." This is the information that Schriener and Haldane equations provide. Those equations give us 16 sample tissue pressures at any moment in time. From that information, many deco models calculate maximum supersaturation and ascent limits are created. The
"duration" component is already included i.e. "time" is already provided by the current sustained maximum value.
Deco models already use the supersaturation information to compute ascents. For example, If a diver extends the time at any given point, the maximum tissue pressure will rise, the time to restore equilibrium will grow, and the deco model will recompute and prescribe a longer deco time. ie. the maximum value in those cells will have risen - the increased supersaturation duration has increased the deco. The process works...
So why do we need a second derivative of the primary measure, this
"integral of supersaturation" to account for
"duration", when both these components are addressed already? What these guys are attempting is to double up on the time component (or replace it) by adding up individual time slices.
Depending on what Simon and friends feel like on the day, they will add up 16 concurrent cell values spaced across the entire exposure, or use tissue gradients instead of actual supersaturation, to arrive at some giant number to prop up the examples. That's invalid. That method puts more weight on the least significant cells, at the expense of the significant ones. It's the "tail is wagging the dog" effect.
No matter which way you cut it, the measure is an inverted one. For any one dive profile, a Super fast (missed) deco dives, have lowest values for integrals of supersaturation, but high supersaturation peaks, that will dissipate more quickly. Simon argues that peaks don't count, but clearly this dive example indicates that supersaturation peaks are the most significant aspect. It also demonstrates that
"integral of supersaturation" is not a useful formula to use here.
David, you let these guys loose to just make stuff up, and that's what they have done. No control or limits or rules to define the proper use of this integral of supersaturation or its components. While they keep posting junk science, I'll keep pointing that out.
**********
The discussion of pDCS across deco times is interesting. There is a rising risk as deco time increases. But at some point it seems to flatten out.

Here we see the A1 and A2 profiles added. The pDCS for these was 4.429% and 5.880% according to NMRI98. The BVM(3) predicted the reverse, and was shown to be wrong by the result. The results are plotted too.
Also why wasn't this nedu test method aborted, when its clear that the A1 datum profile was way outside the normal pDCS range?
This diagram I think actually strengthens my argument that these profiles should have been super safe by ZHL standards. Clearly the the A1 /A2 profiles were not "at the edge" of deco, so the recorded pDCS has gone way down. Now you just need to properly explain the cause of the non decompression stresses that triggered these results.
Interestingly, while VPM-B and ZHL do not predict pDCS, if you do some forcing of these Nedu plans into VPM-B and ZHL, you get a consistent relationship between output times and native VPM-B / ZHL plans. The point being that even if you force VPM-B / ZHL to do these elongated plans, they will provide plans that seemingly properly account for the extra on /off gas changes during these shallow stops test.