SAC versus depth

Please register or login

Welcome to ScubaBoard, the world's largest scuba diving community. Registration is not required to read the forums, but we encourage you to join. Joining has its benefits and enables you to participate in the discussions.

Benefits of registering include

  • Ability to post and comment on topics and discussions.
  • A Free photo gallery to share your dive photos with the world.
  • You can make this box go away

Joining is quick and easy. Log in or Register now!

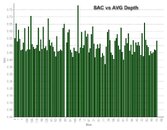
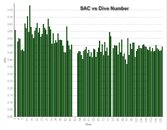
And I see no correlation between depth and air consumption. I notice a clear correlation between exertion and SAC and between how cold I was and SAC but not between the depth and SAC. I also see that my SAC decreases the more diving I have done. Mostly I dive in clear blue water with 100ft plus vis, but sometimes I dive in Lake Champlain, VT and I used to dive in Dutch Springs, PA. In total I have 277 dives and I have plotted my SAC for about 220 of those. My SAC lies almost always between 0.3 cu. ft. per minute and 0.6 cu. ft. per minute. What I notice is a wider spread in SAC from 0.3 to 0.6 at around forty feet average depth but that is simply because more of my dives have an average depth of ~40ft than have an average of 80ft or 20ft. In particular, 25 dives were in Bonaire where my SAC never exceeded 0.4cu. ft. per minute because it's just so amazingly relaxing and warm (I use a 7mm suit) there.

So Mikeraullt hope that helps. If you want to see my data I'll send it to you. Just PM me.

Piscean.
 
mikerault:
Interesting, love to see it.


I went over some of my dive logs this past weekend, and I also can't see any difference in SAC related to depth. I only looked at dives longer than thirty minutes, and not training dives.

Depth ranged from 40 feet to 250 feet.
 
Looking and plotting out by depth are two different things. Try putting the depth and SAC in Excel then ordering the data by depth and doing a plot.
 
Peo:
I went over some of my dive logs this past weekend, and I also can't see any difference in SAC related to depth. I only looked at dives longer than thirty minutes, and not training dives.

Depth ranged from 40 feet to 250 feet.

In theory (doing the arithmetic) depth shouldn't matter. What I've found is that the added equipment load (drag and exertion), combined with the added complexity and reduced visibility (emotional stress) of dives in the 200-300 range versus shallow dives cause my consumption to increase. If you were to say that was not a depth issue per se, but related to other factors correlated with depth, I would agree. This is across roughly 3,000 dives of which about 700 are 200 feet or deeper. Intuitively, scooter dives produce low consumption rates regardless of depth and equipment load.

I've also found that deep dives in clear water produce somewhat lower consumption rates than do deep dives in really dark water.

As I wrote earlier, I think the variance to baseline consumption issue is related to stress conditions and response. Baseline consumption itself is a function of fitness, size, experience, etc.
 
Perhaps you should do a chi square analysis, or a sum of the squares?
A little Beyesian inferrential statistics thrown in probably wouldn't hurt.

The point I'm trying to make here is that, if you analyze everthing enough, you always come to the same result . . . 1.

The diving environment is a dynamic, it's a variable.

In trying to analyze one's SAC for diving, one should not group all the dives together to determine a SAC rate for planning any given dive, but one should group the dives together in as many DIFFERENT sub-groups as possible in order to determine the probable SAC rate for a dive based upon the historical data of previous dives of like characteristics.

ALL THINGS BEING EQUAL - the depth of the dive, for all statistical purposes, should have no bearing upon one's SAC rate.


the K
 
Kraken, might be over kill :) Glad to see the thread unlocked!

Mike
 
Yup, I agree with Kendall. I have never been deeper than 130 (and I don't really have any plans to) so I don't have many changes in the way of equipment but I notice a strong correlation with water temperature (and therefore whether I am cold or not) and stress - though the whole point of diving for me is to get rid of stress :)
 
mikerault and all --

Peo's calculation, I'd say, puts an end to the "inflate/deflate" theory of shallow gas consumption. Except for incredibly inept divers, there's no way to vent enough gas through your BC to make a noticeable difference in SAC.

Not having actually seen your numbers and analysis, if there is a clear negative correlation between depth and SAC -- enough to stand out from the noise -- then there has to be another explanation. Methinks that by lumping all your dives in the same analysis, you're not controlling all the variables.

1. My first thought: are most of your deeper dives in warmer water (as in, shallow, cold lake dives close to home and deeper warm ocean dives on trips)?

There may be other factors. What you have to do is isolate a set of dives so the only variable is depth, and plot just that set. If you still see a correlation between SAC and depth (there really "shouldn't" be any), then start to suspect ...

2. your computer may have a systematic error in depth reading, telling you you're deeper than you actually are (with more error on deeper dives). Even the fact that you've changed computers twice in the series is a variable you haven't controlled for.

3. My computer doesn't calculate average depth, so I don't know whether this is a realistic possibility, but maybe the method of calculating that is off.

Since you can't attach your analysis here, maybe you could put it on your www.rgi-consult.com site. I think we'd all be interested to see the degree of correlation you're getting. If there's any way to code the data points (e.g., blue for cold, red for warm, X for freshwater, O for salt) we might see a pattern that accounts for your observations.
 
mikerault:
Looking and plotting out by depth are two different things. Try putting the depth and SAC in Excel then ordering the data by depth and doing a plot.


Just did this. In Scubase I can create graphs of fields
and sort dives by any field with the click of the mouse.

I have 1 year diving experience. I have around 125 dives total.
Total bottom time is about 102 hours.
All these dives were during 2006
Water temperatures varried between 77 and 87 degrees.
Gear configuration was nearly identical for all dives.
(same wetsuit, same BC, same reg, etc...)
Dives were all saltwater, all over the carribean.
Average depths varry from around 20 to 60 feet.
Max depths never going beyond around 100 ft.
Over half of these dives are Nitrox.

If I sort dives by Average depth and then graph the SAC rates
I don't get any sort of correlation. SAC bounces around
from .4 to .75 cuFt/min.

However, I have noticed some correlations/trends:
- My SAC had a downward trend for the first 50 or so dives.
(From around .6 to .7 down to around .4 to .5)

- My SAC rates tend to increase as water temperature decreases.

- My SAC rates are quite a bit higher if I felt cold on the dive.

- My SAC rates are lower when I don't take my camera along.

- My SAC rates are slightly higher on night dives.

- Very short dives have horrible SAC rates.
I'm assuming alot of this is due to the calculations not
accounting for temperature effects as the tank cools down
to water temperture and it always seems to take a minute
or so for me to get into my relaxed breathing rythm.


The only thing I can think of that could cause higher SAC rates
for shallower depths is that since the light is better, there tends
to be more to see so you are manuvering more and using
more air/breaths to try to hold neutral bouyancy while trying
to watch that cool little creature.

For me I notice a real difference when I have my camera.
Without it, I'm just slowling gliding or hovering along. With
it, I'm manouvering around and somtimes contorting into
positions to get the shot. I think the extra task loading
and breath control to get into position causes me to use more air.


--- bill
 

Attachments

  • SACvsAVGDepth.jpg
    SACvsAVGDepth.jpg
    135 KB · Views: 43
  • SACvsDiveNo.jpg
    SACvsDiveNo.jpg
    133.9 KB · Views: 34
https://www.shearwater.com/products/swift/

Back
Top Bottom