Thanks.Great graphic. Where did you find it?
I made it. Sat down with Planning Mode on a bunch of computers, and with some tables, and played for a while.


Welcome to ScubaBoard, the world's largest scuba diving community. Registration is not required to read the forums, but we encourage you to join. Joining has its benefits and enables you to participate in the discussions.
Benefits of registering include
Thanks.Great graphic. Where did you find it?
We're making progress here. We've gone from "I don't understand it" to "I don't believe it.""We get it, we just don't want it": the point is not that I misunderstand the diagram, the point is that I don't see any reason to believe that chosen data points accurately represent the reality of a dive computer during a dive.
I'm sorry to get this explanation. I was incorrectly defending you, and withdraw that defense.Without stirring this particular pot any more than necessary, let me correct what I believe this graph is showing. You guys are arguing about apples and oranges. You both have valid points but have made some small mistakes in interpreting what you are seeing.
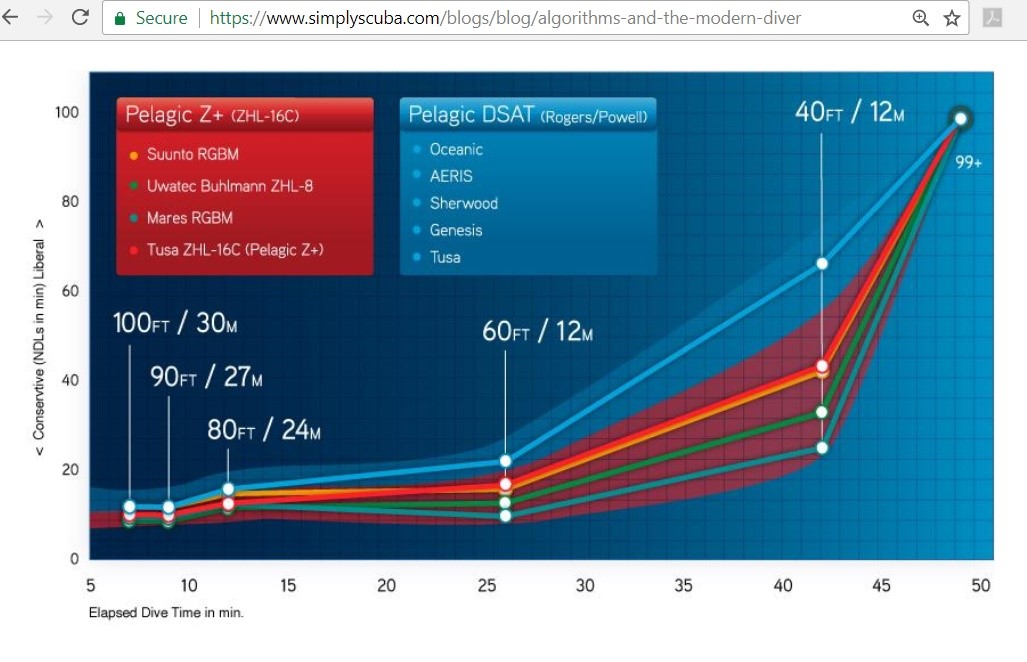
The NDL for my Uwatec set at most liberal is 15 min at 100'
This graph shows that after 7 min at 100 feet, I have about 8 min NDL left. Other computers give you more or less.
I believe that @dmasiuk is correct that this graph is indeed showing SOME points on a multilevel dive. If I ascend to 90 feet and spend a couple more minutes there, I get the benefit of a little more NDL: while I have a little more bottom time, I still have ~8 min left of NDL. All the computers are clustered fairly tightly here.
If I then ascend to 60' all computers provide the benefit of an increasing NDL, and if you continue your dive to a bottom time of 26 min, the NDLs of the various models begin to diverge. If you dive some more and by 42 min then ascend to 40 ft, the divergence becomes significant.
For this arbitrary dive (and yes, it doesn't say when the depth transitions were made, but we assume the simulations were identical among computers) then you can use this divergence to determine how your computer compares with others.
That's all.
I think it's valuable info, and I'm glad of my choice of Uwatec for no stop diving. In fact, I dive it at microbubble L4 for added conservatism (and yes, shorter dives). The microbubble "stops" at L4 begin to approach a Buhlmann GF that I could accept for technical diving when I compare gas plans. But don't read more into this than is there, please.
For this arbitrary dive, you can see how various algorithms diverge. YMMV.
That's okay. Are you happy with your computer? If not would you be tilted toward another based upon the liberal vs. conservative that you see in this graph?
I sure would. I'm older, and there's no way I'm choosing a DSAT algorithm brand.
But it's probably moot for technical diving, since we'll likely choose a brand that doesn't hide its calculations behind proprietary models. That's why Shearwater is cornering the market.
If you dive some more and by 42 min then ascend to 40 ft, the divergence becomes significant.
For this arbitrary dive (and yes, it doesn't say when the depth transitions were made, but we assume the simulations were identical among computers) then you can use this divergence to determine how your computer compares with others.
@dmaziuk I apologize. I don't agree with your specific criticism, (the lines for example) but I agree the graphic is not what it appears to be.
OK, I went to the simplyscuba link and read the article containing the graphic. It provides no information whatsoever about what the graphic means, but the inference is that it is a comparison between the DSAT and the PZ+ algorithms used by Oceanic. I have no idea how they calculated their data points; they may be completely made-up for all I know. Basing a choice of UWATEC on that graphic is silly. I would never even repost that graphic; it is useless.Lol. Just go to the simplyscuba link at the top of the graph and see if you conclude something else than I did. I had to figure out what they were trying to show, too!
Couldn't get further than the first level in this "dive" on my computers planning mode, and guessed at the rest of what they were trying to show.
I'm not defending it at all. It's very simplistic. If it is indeed a theoretical multilevel dive, it is showing what you both know occurs with different algorithms.
It's not conflating Pelagic with RGBM. It's merely showing that at some point in this particular dive, there's an overlap between algorithms.
More important, I think it's showing a divergence that confirms a certain conservatism in my Uwatec. That's why I shared it. I'm not wedded to this, nor do I want to fight with you about the particulars.
I just thought that it was interesting.