El Graduado
Contributor
- Messages
- 833
- Reaction score
- 1,656
I was curious what the various colors represented on the graph you posted. Here is what I found out about the graph and its original author:
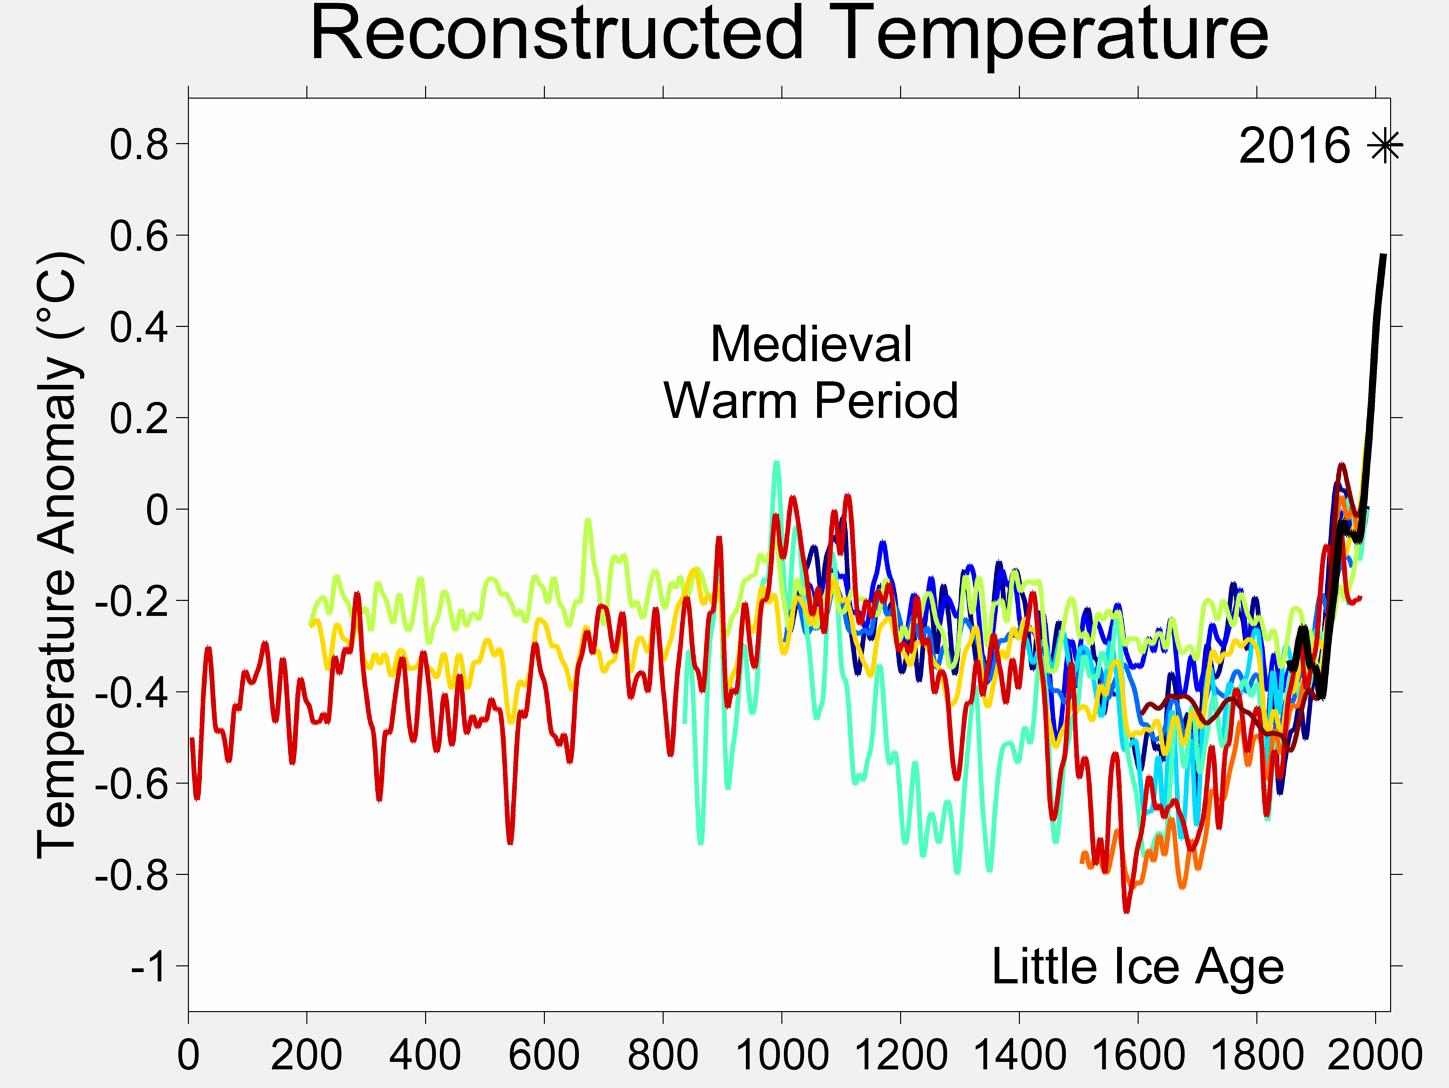
This image is a comparison of 100009 different published reconstructions changes during the last 2000 years. More recent reconstructions are plotted towards the front and in redder colors, older reconstructions appear towards the back and in bluer colors. An instrumental history of temperature is also shown in black. The medieval warm period and little ice age are labeled at roughly the times when they are historically believed to occur, though it is still disputed whether these were truly global or only regional events. The single, unsmoothed annual value for 2004 is also shown for comparison. (Image:Instrumental Temperature Record.png shows how 2004 relates to other recent years).
For the purposes of this comparison, the author is agnostic as to which, if any, of the reconstructions of global mean temperature is an accurate reflection of temperature fluctuations during the last 2000 years. However, since this plot is a fair representation of the range of reconstructions appearing in the published scientific literature, it is likely that such reconstructions, accurate or not, will play a significant role in the ongoing discussions of global climate change and global warming.
For each reconstruction, the raw data has been decadally smoothed with a σ = 5 yr Gaussian weighted moving average. Also, each reconstruction was adjusted so that its mean matched the mean of the instrumental record during the period of overlap. The variance (i.e. the scale of fluctuations) was not adjusted (except in one case noted below).
Except as noted below, all original data for this comparison comes from (http://www.ncdc.noaa.gov/data-access/paleoclimatology-data/datasets/climate-reconstruction) and links therein. It should also be noted that scientific challenges to methodology and data used in several of the references have been substantiated and reconstructions of past climate report substantial error bars, which are not represented on this figure.
The reconstructions used, in order from oldest to most recent publication are:
- (dark blue 1000-1991): P.D. Jones, K.R. Briffa, T.P. Barnett, and S.F.B. Tett (1998). "High-resolution Palaeoclimatic Records for the last Millennium: Interpretation, Integration and Comparison with General Circulation Model Control-run Temperatures". The Holocene8: 455-471. doi:10.1191/095968398667194956
- (blue 1000-1980): M.E. Mann, R.S. Bradley, and M.K. Hughes (1999). "Northern Hemisphere Temperatures During the Past Millennium: Inferences, Uncertainties, and Limitations". Geophysical Research Letters26 (6): 759-762.
- (light blue 1000-1965): Crowley and Lowery (2000). "Northern Hemisphere Temperature Reconstruction". Ambio29: 51-54. Modified as published in Crowley (2000). "Causes of Climate Change Over the Past 1000 Years". Science289: 270-277. doi:10.1126/science.289.5477.270
- (lightest blue 1402-1960): K.R. Briffa, T.J. Osborn, F.H. Schweingruber, I.C. Harris, P.D. Jones, S.G. Shiyatov, S.G. and E.A. Vaganov (2001). "Low-frequency temperature variations from a northern tree-ring density network". J. Geophys. Res.106: 2929-2941.
- (light turquoise 831-1992): J. Esper, E.R. Cook, and F.H. Schweingruber (2002). "Low-Frequency Signals in Long Tree-Ring Chronologies for Reconstructing Past Temperature Variability". Science295 (5563): 2250-2253. doi:10.1126/science.1066208.
- (green 200-1980): M.E. Mann and P.D. Jones (2003). "Global Surface Temperatures over the Past Two Millennia". Geophysical Research Letters30 (15): 1820. doi:10.1029/2003GL017814.
- (yellow 200-1995): P.D. Jones and M.E. Mann (2004). "Climate Over Past Millennia". Reviews of Geophysics42: RG2002. doi:10.1029/2003RG000143
- (orange 1500-1980): S. Huang (2004). "Merging Information from Different Resources for New Insights into Climate Change in the Past and Future". Geophys. Res Lett.31: L13205. doi:10.1029/2004GL019781
- (red 1-1979): A. Moberg, D.M. Sonechkin, K. Holmgren, N.M. Datsenko and W. Karlén (2005). "Highly variable Northern Hemisphere temperatures reconstructed from low- and high-resolution proxy data". nature443: 613-617. doi:10.1038/nature03265
- (dark red 1600-1990): J.H. Oerlemans (2005). "Extracting a Climate Signal from 169 Glacier Records". Science308: 675-677. doi:10.1126/science.1107046
- (black 1856-2004): Instrumental data was jointly compiled by the w:Climatic Research Unit and the UK Meteorological OfficeHadley Centre. Global Annual Average data set TaveGL2v [2] was used.
The person who created this graph and posted it on Wikipedia is Robert A. Rohde. This is what he wrote about himself:
I am a recent Physics PhD from the University of California, Berkeley. I joined the physics department, following undergraduate degrees in physics and mathematics, but despite having taken all the traditional physics coursework (e.g. quantum mechanics, cosmology, general relativity, etc.), I ultimately discovered those topics are not what I want to devote my life to. Most of my research time has been focused on the earth sciences, climatology and related areas. Currently I am employed as the lead scientist for Berkeley Earth Surface Temperature.
My first edit to Wikipedia was August 3, 2003, though it took many months of sporadic drive-by editing before I really became engaged in the community. I've been an administrator since August 2005 (though it feels like a whole lot longer). I am historically also a botoperator (though I do not run it currently) and have contributed several patches to the Mediawiki software running Wikipedia.
Much of my work on wiki has been related to climate change/global warming, but I also dabble in a wide array of other areas, mostly sciences, related to my interests and skills. One of my specialties is the creation of custom graphics to use as illustrations. This has led to an unusual spin off as I have collected my work with that of others to create a new website devoted to global warming data and art.
Contact
Wikipedians can reach me by leaving messages on my talk page. I'll usually respond within a day or two.
Professional or press inquiries related to the images I have created can be directed to robert@globalwarmingart.com.


