So i think i figured it out but i am not an expert and not sure.
Today i observed the two computers closely during the dives and noticed the Garmin updates info much faster the the Ratio.
I stopped moving completely and waited a few second and the Ratio catched up to the garmin and after a few seconds showed the same NDL.
So i think the discrepency happens because the garmin shows the info faster or perhaps it collects the data in faster HZ intervals.
Anyway, as promised here are the logs from both the computers for the dives tommorow. Again, i am not smart enough to read them in high level of understanding but they look the same to me pretty much.
Maybe someone else has a better idea.
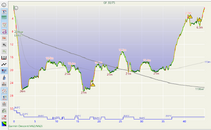
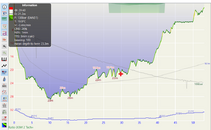
Dive 1: Elpida
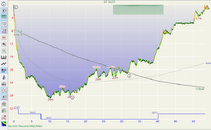
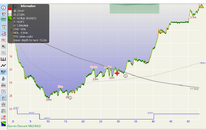
Dive 2: Zenobia
Thanks
Today i observed the two computers closely during the dives and noticed the Garmin updates info much faster the the Ratio.
I stopped moving completely and waited a few second and the Ratio catched up to the garmin and after a few seconds showed the same NDL.
So i think the discrepency happens because the garmin shows the info faster or perhaps it collects the data in faster HZ intervals.
Anyway, as promised here are the logs from both the computers for the dives tommorow. Again, i am not smart enough to read them in high level of understanding but they look the same to me pretty much.
Maybe someone else has a better idea.
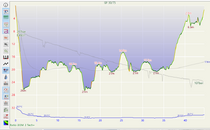
Dive 1: Elpida
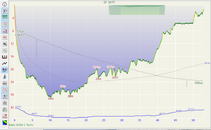
Dive 2: Zenobia
Thanks